Last November, Dilip Chandra from Ahmedabad pulled up his Seller Central dashboard and smiled. His monthly revenue had crossed ₹8.5 lakh for the first time. He assumed business was booming. Then his CA asked him to actually trace every rupee, and the picture changed entirely. After accounting for referral fees, FBA charges, return costs, ad spend, and GST on platform fees, Dilip’s real take-home was under ₹90,000. More than 89% of his revenue had vanished into costs he had never tracked in one place.
His story is not unusual. Most Amazon sellers in India confuse revenue with profit because they have never built an amazon profit and loss statement for their business. This post will show you exactly how to read one, how to build one from Seller Central reports, and how to use it to stop guessing your margins and start making decisions rooted in real numbers.
Why Most Amazon Sellers Have No Idea What They Actually Earn
The Revenue Trap That Fools New Sellers
Seller Central’s main dashboard shows you ordered product sales and units sold. Those numbers feel like progress, and they are, but they are not profit. The gap between gross revenue and net profit on Amazon.in can range anywhere from 35% to 55% depending on your category, fulfilment method, and ad spend. Kavitha Nair from Kochi learned this the hard way. She saw ₹1.2 lakh in monthly sales on her handmade jewellery line and assumed she was doing well. When she finally subtracted every fee, her actual net profit was ₹48,000. Nearly 60% of her revenue was gone before she ever saw it in her bank account.
The Cost Layers Amazon Never Shows You in One Place
The problem is not that Amazon hides information. The data exists. It is just scattered across four or five different reports. Referral fees sit in one place. FBA fulfilment and weight handling charges appear somewhere else. Storage fees have their own report. Return processing costs are buried in transaction details. Ad spend lives in the advertising console entirely. And GST charged on all those platform fees never appears alongside the fees themselves. No single screen in Seller Central shows your true margin, which is exactly why most sellers never calculate it properly. If you have never explored what is available, our guide on key metrics to monitor in Seller Central is a good starting point.

What Is an Amazon Profit and Loss Statement?
The P&L Statement in Plain Language
An amazon P&L statement is a financial report that subtracts every cost from every rupee you earned over a set period, usually a month or a quarter. It shows three critical numbers. Gross profit tells you what remains after product costs and Amazon fees. Operating profit shows what is left once you subtract advertising, software, and other running costs. Net profit is the final number after every single expense, including taxes. Together, these three figures tell you whether your Amazon business is surviving, breaking even, or actually growing. Without them, you are running your business on hope rather than data.
Cash Basis vs Accrual Basis — Which One to Use
Amazon’s Date Range Report works on a cash basis, meaning it records transactions when money moves in or out of your account. Accrual accounting, on the other hand, matches revenue and expenses to the month the sale actually happened, regardless of when Amazon deposits the funds. For Indian sellers filing regular GST returns, the accrual method gives a far more accurate month-to-month picture because it aligns with your tax reporting periods. If you are just starting out and want simplicity, the cash method works. But as your business grows past ₹5 lakh in monthly sales, switching to accrual will give you the clarity you need to make real decisions.
The Seller Central Reports You Need to Build Your P&L
Date Range Report (Your Starting Point)
Head to Reports, then Payments, then Date Range Report in your Seller Central account. This is the foundation of your entire amazon profit and loss statement. The Summary view gives you two essential numbers: total revenue and total Amazon fees for any period you choose. The Transaction view goes deeper, giving you line-by-line detail for every order, refund, fee, and adjustment. Generate this report monthly and you already have half the data you need.
Business Reports and FBA Fee Reports
Your next stop is the Business Reports section under the amazon seller central reports tab. The Sales and Traffic report shows units sold, sessions, and conversion rates, which help you understand how efficiently you are turning traffic into sales. For cost visibility at the SKU level, download the FBA Storage Fee report and the Fee Estimate report. These reveal exactly how much Amazon is charging you per product for storage and fulfilment, numbers that are easy to overlook when you only check the dashboard summary. For a deeper walkthrough of every report worth tracking, check out our post on free reports inside Seller Central most Indian sellers never check.
Where COGS and Off-Amazon Costs Fit In
Here is the gap most sellers miss: Seller Central has no idea what you paid for your products. Your purchase price, freight from the supplier, customs duty, packaging material, and labelling costs are all invisible to Amazon. You must add your cost of goods sold manually. Arjun Reddy from Hyderabad started tracking his landed COGS per SKU in a simple spreadsheet last January. Within two months, he discovered that two of his eight products had been loss-making for over six months. He had been subsidising them with profits from his other SKUs without realising it.
If building your first P&L feels overwhelming, start with a simple tracker that lists revenue, Amazon fees, COGS, and ad spend per month. Even a basic spreadsheet will reveal patterns you have never noticed before.
How to Calculate Profit on Amazon Step by Step
Step 1 — Calculate Net Sales Revenue
Start with total sales from your Date Range Report, then subtract returns, refunds, and any promotional discounts or coupon redemptions. The number you are left with is your net sales revenue. This is the real money customers paid for your products after Amazon processed all the adjustments. Treat this as your starting line, not your gross sales figure.
Step 2 — Subtract Amazon Fees and COGS
Next, add up every Amazon fee: referral fees, closing fees, FBA or Easy Ship fulfilment charges, and storage fees. Subtract this total from your net sales revenue. Then subtract your COGS, which is your landed cost per unit multiplied by units sold. The result is your gross profit. This is the number that tells you whether your pricing and product economics are fundamentally healthy before any operational expenses enter the picture. If you are unsure how all those fee types add up, our breakdown of understanding Amazon fees walks through each one in detail.
Step 3 — Subtract Operating Expenses
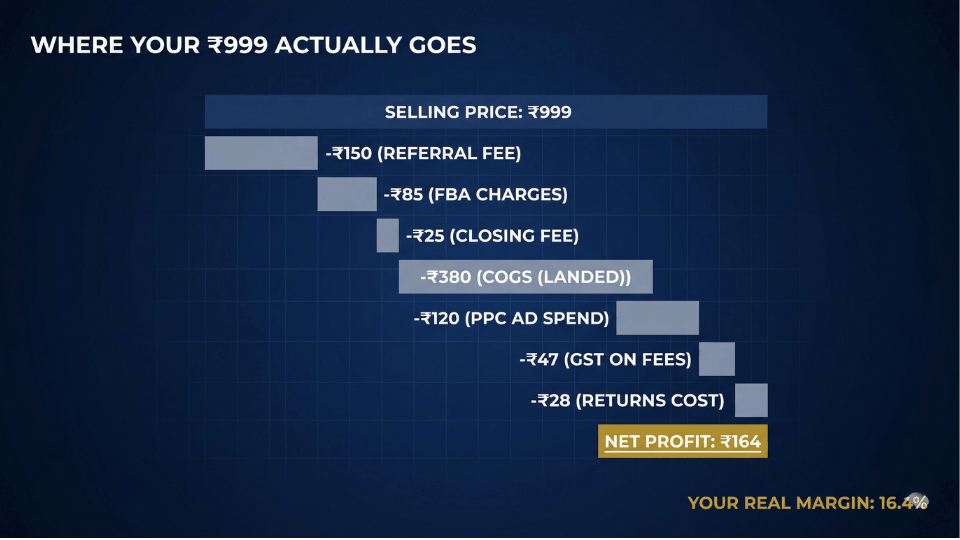
Now subtract everything else that keeps your business running: PPC ad spend, software subscriptions, product photography, virtual assistant costs, and GST on Amazon platform fees. The figure you land on is your net profit. To calculate your net profit margin, divide net profit by net sales revenue and multiply by 100. Meera Iyer from Chennai ran this amazon FBA profit calculation for the first time last March and found her actual margin was 14%, not 28% she had been estimating in her head.
You can also use our own free tool to calculate the profit and loss.
Amazon Hidden Fees That Silently Kill Your Margins
Return Processing and Reverse Shipping Costs
Returns do not just erase revenue. They create new costs. When a customer returns a product through FBA, you pay return shipping charges, return processing fees, and in many cases the item comes back in unsellable condition. For categories like fashion and electronics on Amazon.in, return rates can run between 15% and 25%. At a 20% return rate, your effective margin on every hundred units drops dramatically because you are absorbing costs on twenty units that generated zero revenue. Our article on proven strategies to reduce Amazon return rates covers practical ways to bring those numbers down.
GST on Amazon Fees — The Cost Most Indian Sellers Ignore
Amazon charges 18% GST on referral fees, closing fees, and FBA fulfilment fees. Most sellers know about the fees themselves but forget the tax on top. On a ₹500 product where platform fees total ₹120, the GST adds another ₹21.60 per order. That sounds small until you multiply it across 2,000 or 5,000 monthly orders. Suddenly you are looking at ₹40,000 to ₹1,00,000 in annual GST on fees alone, money that many sellers never factor into their amazon seller profit margin calculations. For a full picture of how GST affects your bottom line, read our guide on how GST impacts Amazon sellers in India.
Long-Term Storage and Aged Inventory Penalties
FBA storage fees increase sharply for inventory sitting in Amazon warehouses beyond 180 days. What starts as a manageable monthly storage charge becomes a penalty that can eat through whatever margin the product had left. Sneha Patil from Nagpur discovered she had accumulated ₹45,000 in aged inventory surcharges over a single quarter on slow-moving kitchen products. She ran a removal order, liquidated the stock at a small loss, and freed up both warehouse space and working capital. The lesson: inventory that does not move is not just idle, it is actively costing you money.

What a Good Amazon Seller Profit Margin Looks Like
Benchmarks That Actually Mean Something
A net amazon seller profit margin between 15% and 20% is healthy for most Amazon.in categories. If you are consistently above 20%, you are executing well across pricing, cost control, and advertising efficiency. Below 10% is a warning sign because a single bad month of returns or an ad spend spike can push you into negative territory. These benchmarks are not arbitrary. They account for the typical fee structure on Amazon India, including referral fees that range from 5% to 17% depending on category, FBA charges based on weight slabs, and the reality that most sellers spend 8% to 15% of revenue on advertising.
Why Comparing Margins Across Categories Is a Trap
Electronics margins look completely different from beauty, which looks nothing like home and kitchen. A 12% net margin on a high-volume electronics SKU might generate more absolute profit than a 30% margin on a slow-moving niche product. What matters far more than hitting a specific percentage is your margin trend over three to six months. Is it stable? Climbing? Slowly eroding? That trajectory tells you whether your business decisions are working or whether costs are quietly catching up to your revenue growth.
If you want to see how your numbers compare against category-level benchmarks on Amazon.in, our margin comparison guide walks you through the exact metrics to track and what they mean for your specific product mix.
How to Use Your P&L to Make Smarter Business Decisions
Monthly P&L Reviews — What to Look For
The amazon profit and loss statement only becomes powerful when you review it regularly. Set a monthly date to sit down with your numbers and ask three questions. Is ad spend rising faster than revenue? Are return rates climbing for specific SKUs? Is COGS creeping up because your supplier raised prices or shipping costs increased? These patterns are invisible when you check your dashboard casually, but they jump off the page when you compare your P&L month over month. The sellers who build this habit are the ones who catch margin leaks early, before they become serious problems.
Cutting Loss-Making SKUs Before They Drain You
One of the most valuable things a per-SKU P&L reveals is which products are actually losing money. Vikram Joshi from Jaipur had been running twelve SKUs for over a year. When he finally built a product-level amazon P&L statement, he found that three of those SKUs had negative margins after ad spend and returns. He discontinued all three, redirected that ad budget to his top five performers, and watched his account-level net margin improve by 6% within two months. Most sellers resist killing products because it feels like shrinking their business. In reality, cutting losers is one of the fastest ways to grow your actual profit.
Frequently Asked Questions
How do I create a profit and loss statement for my Amazon business?
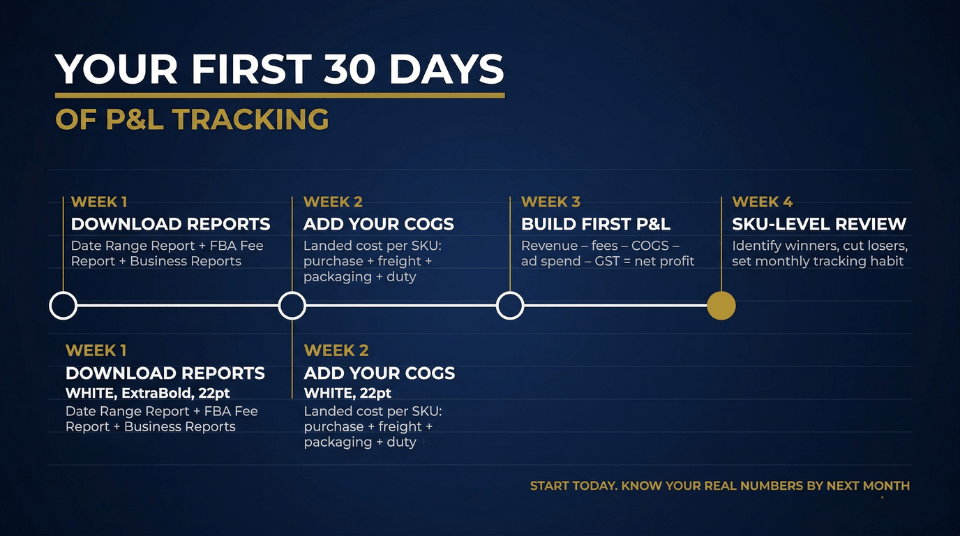
Start by downloading the Date Range Report from Seller Central under Reports then Payments. This gives you total revenue and Amazon fees. Add your cost of goods sold, ad spend, and other operating expenses in a spreadsheet. Subtract all costs from revenue to get net profit. Review it monthly for the clearest picture of your financial health.
What reports do I need from Seller Central to calculate my real profit?
You need the Date Range Report for revenue and fees, the Business Reports section for sales and traffic data, the FBA Storage Fee report for inventory costs, and the Fee Estimate report for per-SKU fee breakdowns. Combine these with your own COGS records and advertising console data for a complete view.
What is a good profit margin for Amazon sellers?
For Amazon.in sellers, a net profit margin between 15% and 20% is considered healthy across most categories. Above 20% signals strong execution. Below 10% is a warning that rising costs or inefficient spending could tip you into losses. Focus on tracking your margin trend over months rather than fixating on a single number.
How do Amazon fees affect my profit and loss statement?
Amazon deducts referral fees, closing fees, FBA fulfilment charges, storage fees, and return processing fees from your revenue. On top of these, 18% GST applies to all platform fees for Indian sellers. Together, these deductions can account for 30% to 45% of your selling price, making them the single largest expense category in most P&L statements.
What hidden costs do Amazon sellers miss when calculating profit?
The most commonly overlooked costs include GST on Amazon platform fees, return processing and reverse shipping charges, long-term storage surcharges on aged inventory, payment processing and currency conversion fees for global sellers, and the true landed cost of goods including freight, customs, and packaging. Missing even one of these can inflate your perceived margin by 5% to 10%.
Can I build a P&L statement per ASIN on Amazon.in?
Yes, though Amazon does not provide a ready-made per-ASIN P&L. You can build one by combining transaction-level data from the Date Range Report with per-SKU fee estimates and your own COGS figures. This SKU-level view is essential for identifying which products are profitable and which are dragging your account down.
How often should I review my Amazon P&L statement?
Monthly reviews are ideal for most sellers. This gives you enough data to spot trends without waiting so long that problems compound. If you are in a high-volume or high-return category, consider a fortnightly check on key metrics like ad spend ratio and return rates, with a full P&L review at month end.
Do I need accounting software or can I use a spreadsheet?
A well-organised spreadsheet works perfectly for sellers with fewer than 15 to 20 SKUs. Google Sheets or Excel with columns for revenue, each fee type, COGS, ad spend, and net profit is all you need to start. As your catalogue and order volume grow, tools like Tally, Zoho Books, or specialised Amazon analytics platforms can automate much of the data pulling and calculation.
Conclusion
Revenue tells you how big your business looks. Profit tells you how healthy it actually is. The amazon profit and loss statement is not paperwork or accounting homework. It is the single document that tells you whether your Amazon business is genuinely working or just spinning its wheels. Once you start reading your numbers monthly, you stop reacting to surprises and start making decisions based on evidence.
If you are ready to go beyond margins and build a complete operational and financial framework for your Amazon business in India, the 3-Day Amazon Business Training walks you through everything from product selection to profitability systems that actually scale.