
Eleven at night in Coimbatore, and Divya has three browser tabs open: her listing, a competitor’s listing, and a keyword tool she pays for monthly. She is trying to work out why a rival’s turmeric latte mix outsells hers four to one when her reviews are better. She guesses. She changes her title. Nothing moves. What she does not realise is that Amazon already holds the answer, sitting in a report she is entitled to open and has never clicked.
That report is Amazon Brand Analytics, and learning how to use Amazon Brand Analytics properly is the difference between redesigning your listing on a hunch and redesigning it because you can see exactly which three ASINs are absorbing the clicks for your best search term. It tells you what shoppers typed, what they clicked, what they bought instead, and what they added to the same basket.
None of this is mysterious once somebody walks you through the screens. Over the next few sections you will get the tour, the interpretation rules, and a weekly routine short enough that you will actually keep it going past the first fortnight.
What Brand Analytics Actually Tells You
Think of it as Amazon handing you a slice of its own shopper research, aggregated and anonymised, covering your category rather than just your account.
Who can open these reports and what it costs
Brand Analytics is included for sellers enrolled in Amazon Brand Registry, with no separate subscription on top of your Professional selling plan. If your brand is enrolled and your listings are linked to it, the reports are already waiting behind your Seller Central login. The real cost is attention, not money.
The report families you get in one place
You get search term data, item comparison and alternate purchase reports, market basket analysis, repeat purchase behaviour, and demographic summaries. Each answers a different question: what shoppers look for, who they consider instead of you, what they pair with your product, and whether they ever come back. Used together they cover discovery, conversion and loyalty.
Why guesswork loses to shopper data on Amazon.in
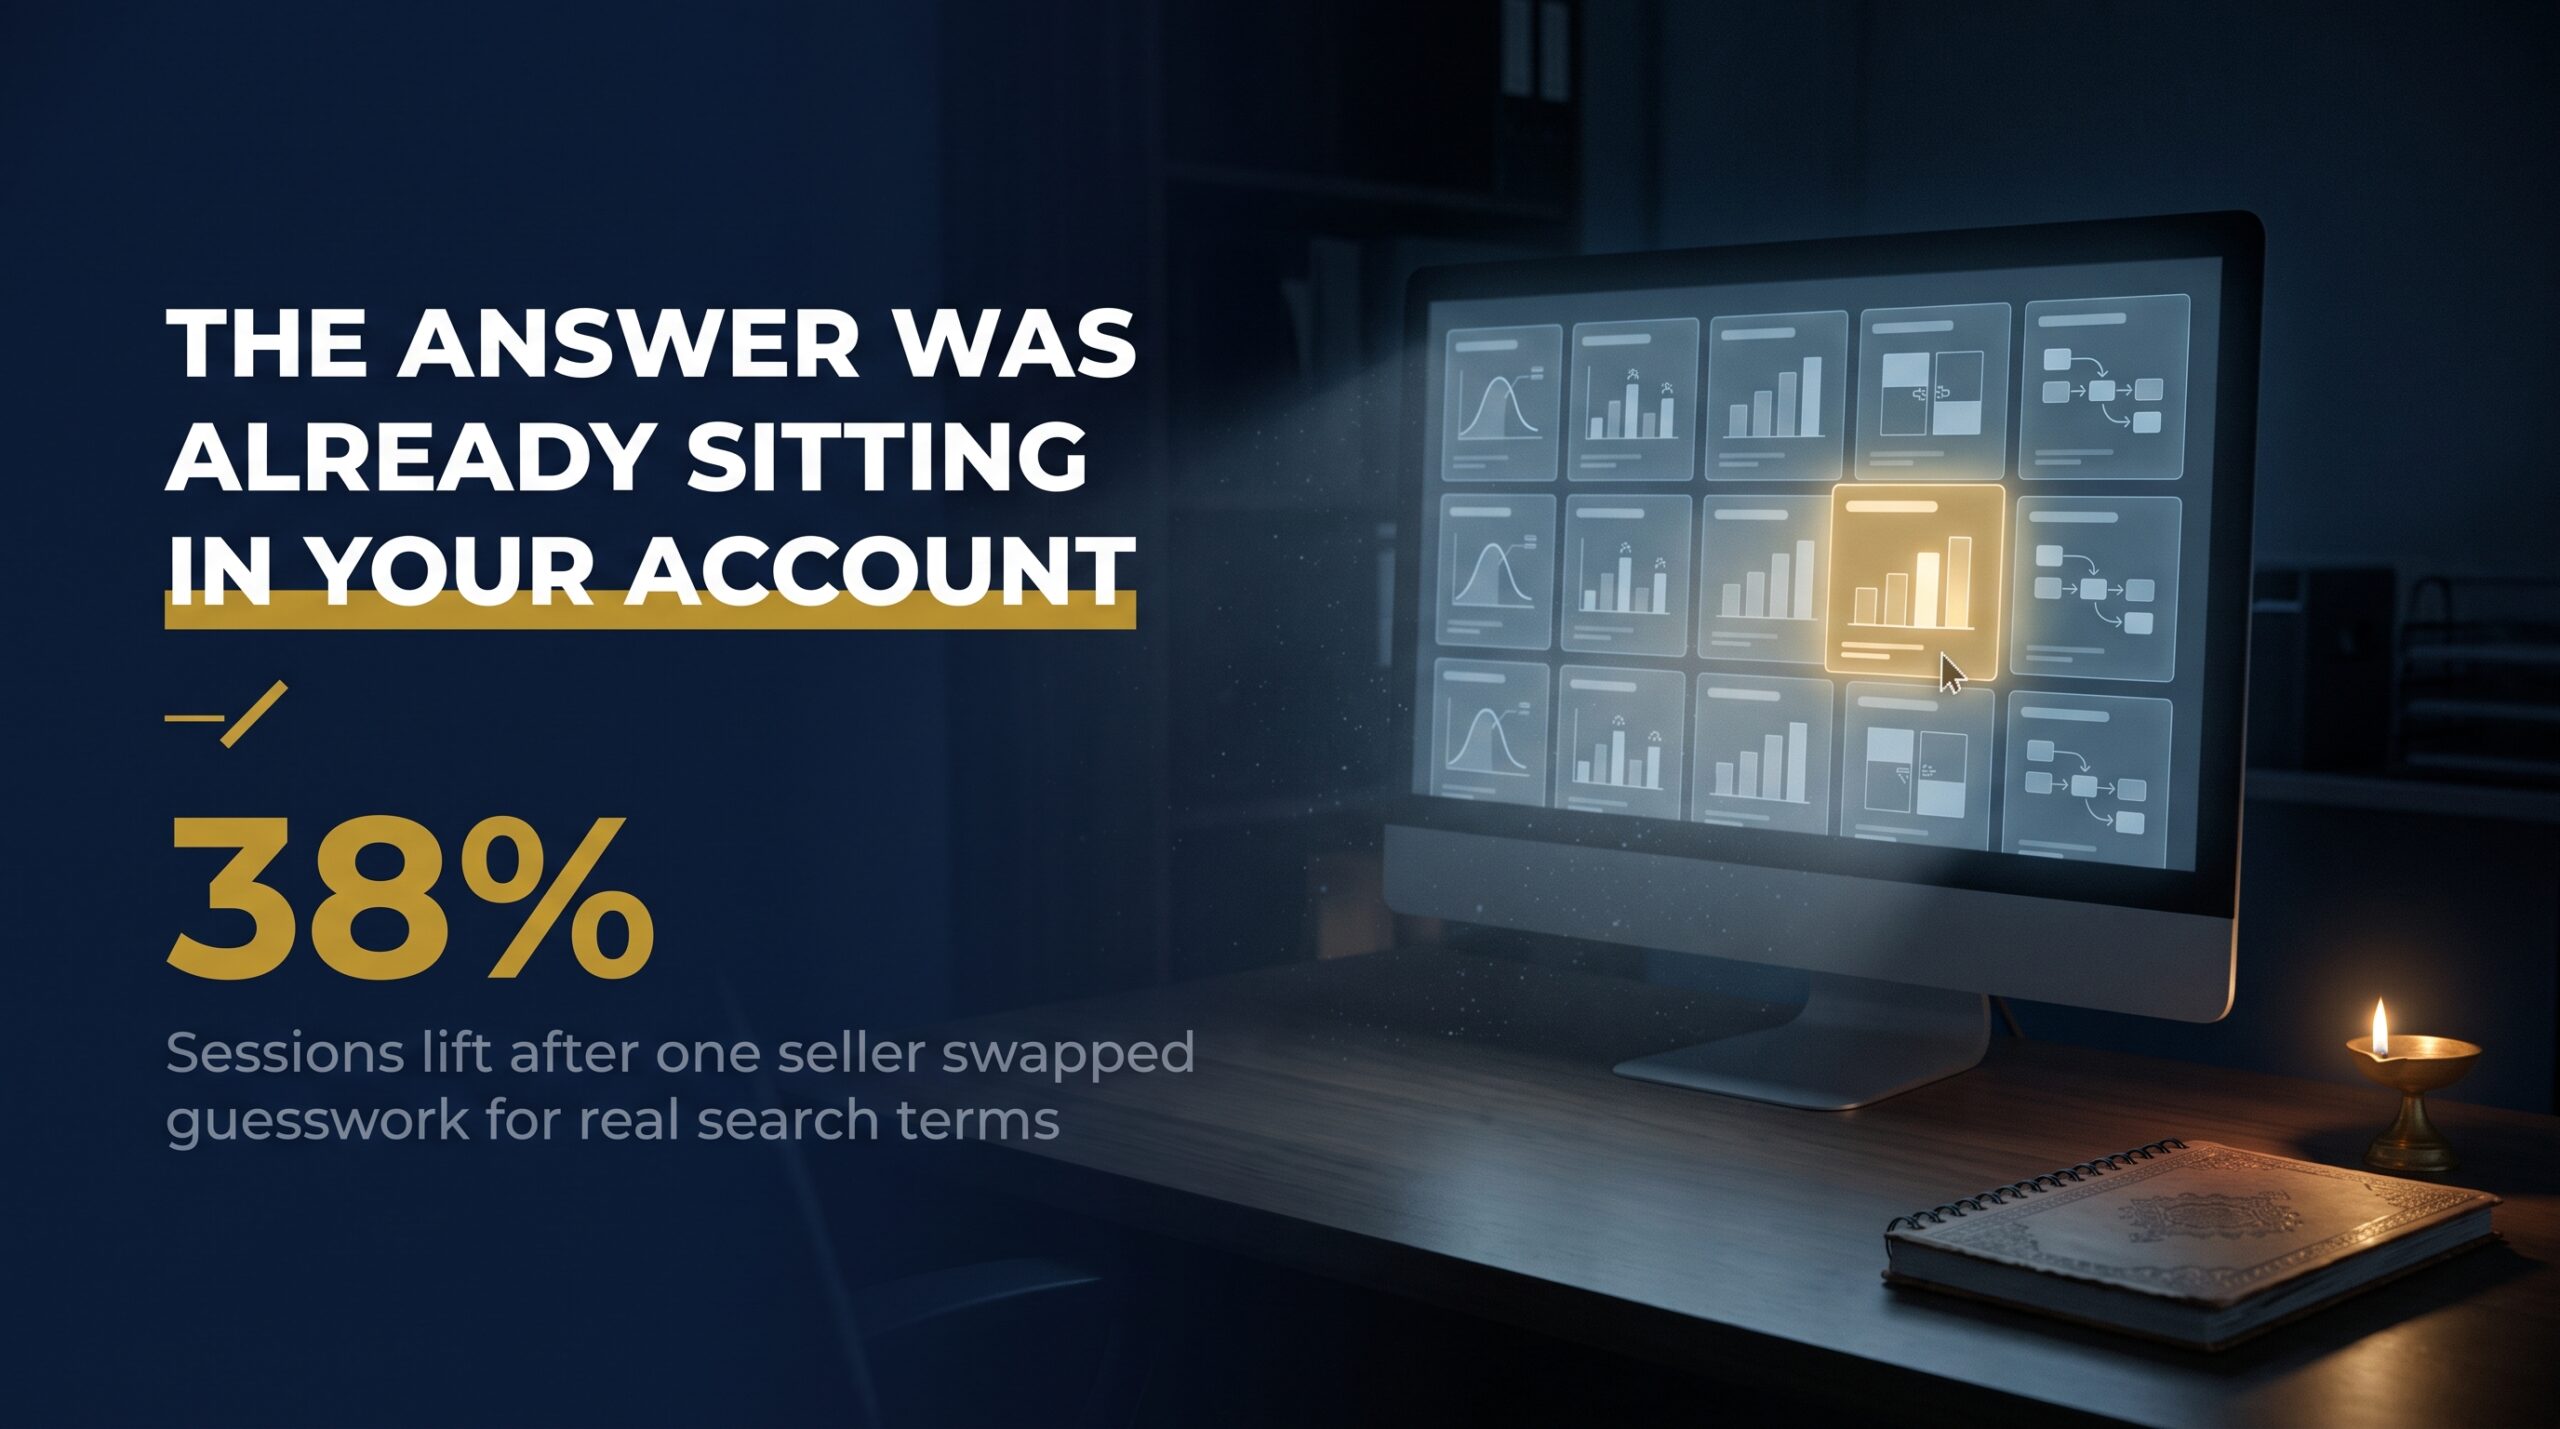
Rajesh Menon in Kochi sold stainless steel lunch boxes and had assumed his buyers searched “steel tiffin box”. The search terms data showed “office lunch box for men” ranked far higher in his category. He rewrote his title and backend terms, and sessions rose 38% in six weeks. The lesson: your customers rarely use your vocabulary.
Getting Your Brand Registry Sorted First
No enrolment, no reports. That is the one genuine gate, and it is worth clearing properly rather than halfway.
The trademark rule Indian sellers must clear
When sellers ask about the brand registry trademark requirement India enforces, the answer is refreshingly plain: you need a trademark that is either registered or pending with the relevant IP office, held in the name of your selling entity, matching the brand on your packaging. A pending application filed through Amazon’s IP Accelerator route can qualify you sooner, which matters when registration timelines stretch across many months.
Enrolling a brand step by step
Once your trademark is in hand, the enrolment itself takes an afternoon if your paperwork is tidy.
- Create or sign into your Brand Registry account using the same credentials as your seller account.
- Enter the brand name exactly as it appears on the trademark record, plus the application or registration number.
- List the categories your products sell in and the countries where you manufacture and distribute.
- Upload images of your product and packaging showing the brand permanently affixed, not a printed sticker.
- Verify through the code Amazon sends to the contact on the trademark record, then link your existing ASINs.
Meera Iyer in Ahmedabad enrolled her cotton homeware brand on a pending mark, and had Brand Analytics open within three weeks of filing. She stopped waiting for registration to begin.
Adding team members and setting permissions
Brand Registry lets you assign roles, so your cataloguing assistant can edit listings while only you and your ads manager view analytics. Set this up on day one. Retrofitting permissions after a freelancer leaves is a far less pleasant afternoon.
Finding Your Way Around the Dashboard
Most sellers who abandon these reports do so because they could not find them twice in a row. Fix the navigation habit first.
Where the reports sit inside Seller Central
From the main menu, open the Brands section and choose Brand Analytics. The amazon brand analytics dashboard loads with report tabs across the top rather than buried in submenus. Bookmark that URL directly so you land there in one click every Monday instead of hunting through three layers.
Picking date ranges, categories and ASIN filters
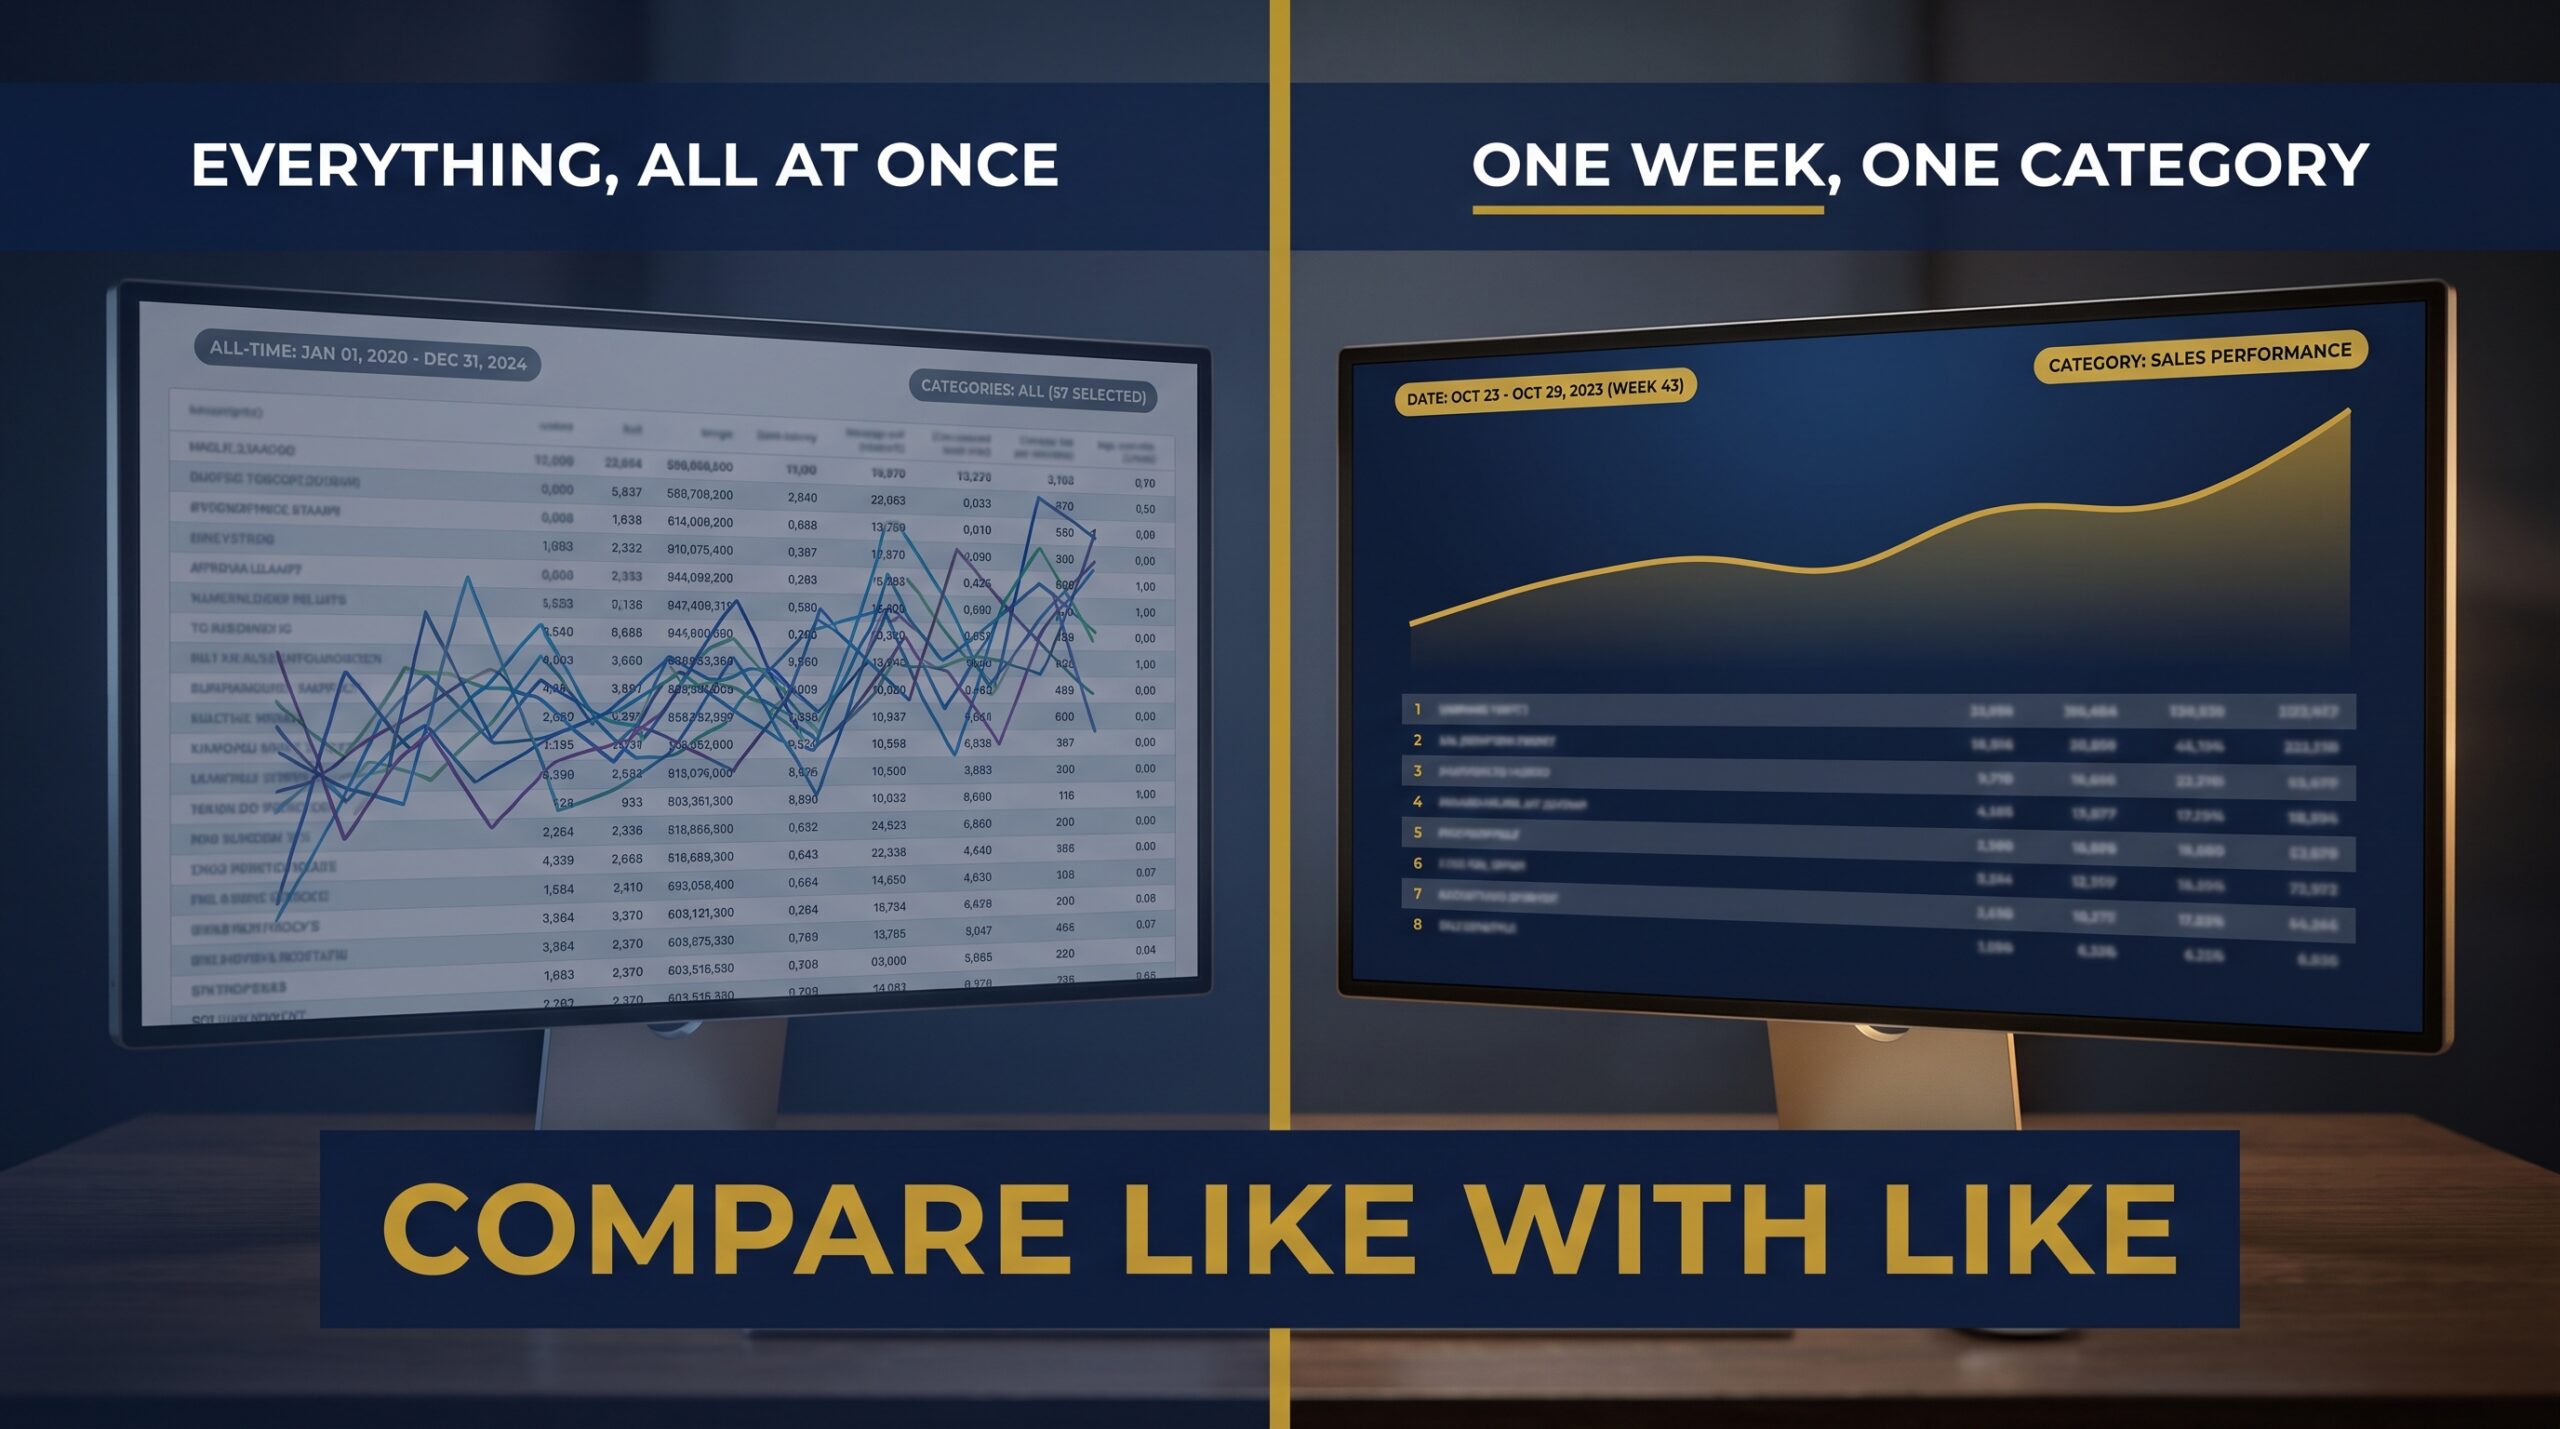
Every report lets you choose a reporting period, usually weekly, monthly, quarterly or annual, and filter by category, subcategory, brand or specific ASIN. Weekly views expose momentum; quarterly views expose seasonality. Compare like with like, because a festive week against a regular week will tell you almost nothing useful.
Exporting data you can actually work with
Download to CSV and keep one sheet per report, dated. Arjun Nair in Pune built a simple spreadsheet of his top twelve search terms and updated it every Monday for four months; by month five he could see which terms were rising before his competitors adjusted their bids. The lesson: a comparable history beats a single beautiful snapshot.
If building that kind of disciplined review feels like something you would rather not figure out alone, join the 3-Day Amazon Business Training and work through it with sellers doing the same thing.
Mining the Search Terms Report for Keywords
This is the report most sellers open first and misread fastest. It is worth slowing down on.
Reading search frequency rank without misjudging it
The amazon brand analytics search terms report ranks queries by popularity, where rank 1 is the most searched term in that category for that period. Search frequency rank amazon uses is relative, not a volume count, and the gap between rank 50 and rank 500 is enormous while the gap between 4,000 and 4,500 is trivial. Track the direction a term moves, not its absolute position.
Spotting the three ASINs that own a term
For each search term you see the three most clicked ASINs, plus their click share and conversion share. If one brand holds two of the three slots, that is your real competitor, whatever you assumed. Open those listings and study price, main image, review count and A+ content before deciding anything.
Turning real demand into a keyword shortlist
Sunita Rao in Jaipur pulled sixty terms for her ayurvedic hair oil, cut them to eighteen where the top three ASINs converted below 20%, and rebuilt her listing around those. Organic orders rose 27% in two months. The lesson: chase terms where the incumbents are beatable, not merely popular.
Making Sense of Click Share and Conversion Share
Two numbers, read together, will tell you where your problem lives. Read separately, they mislead.
What the two numbers reveal when read together
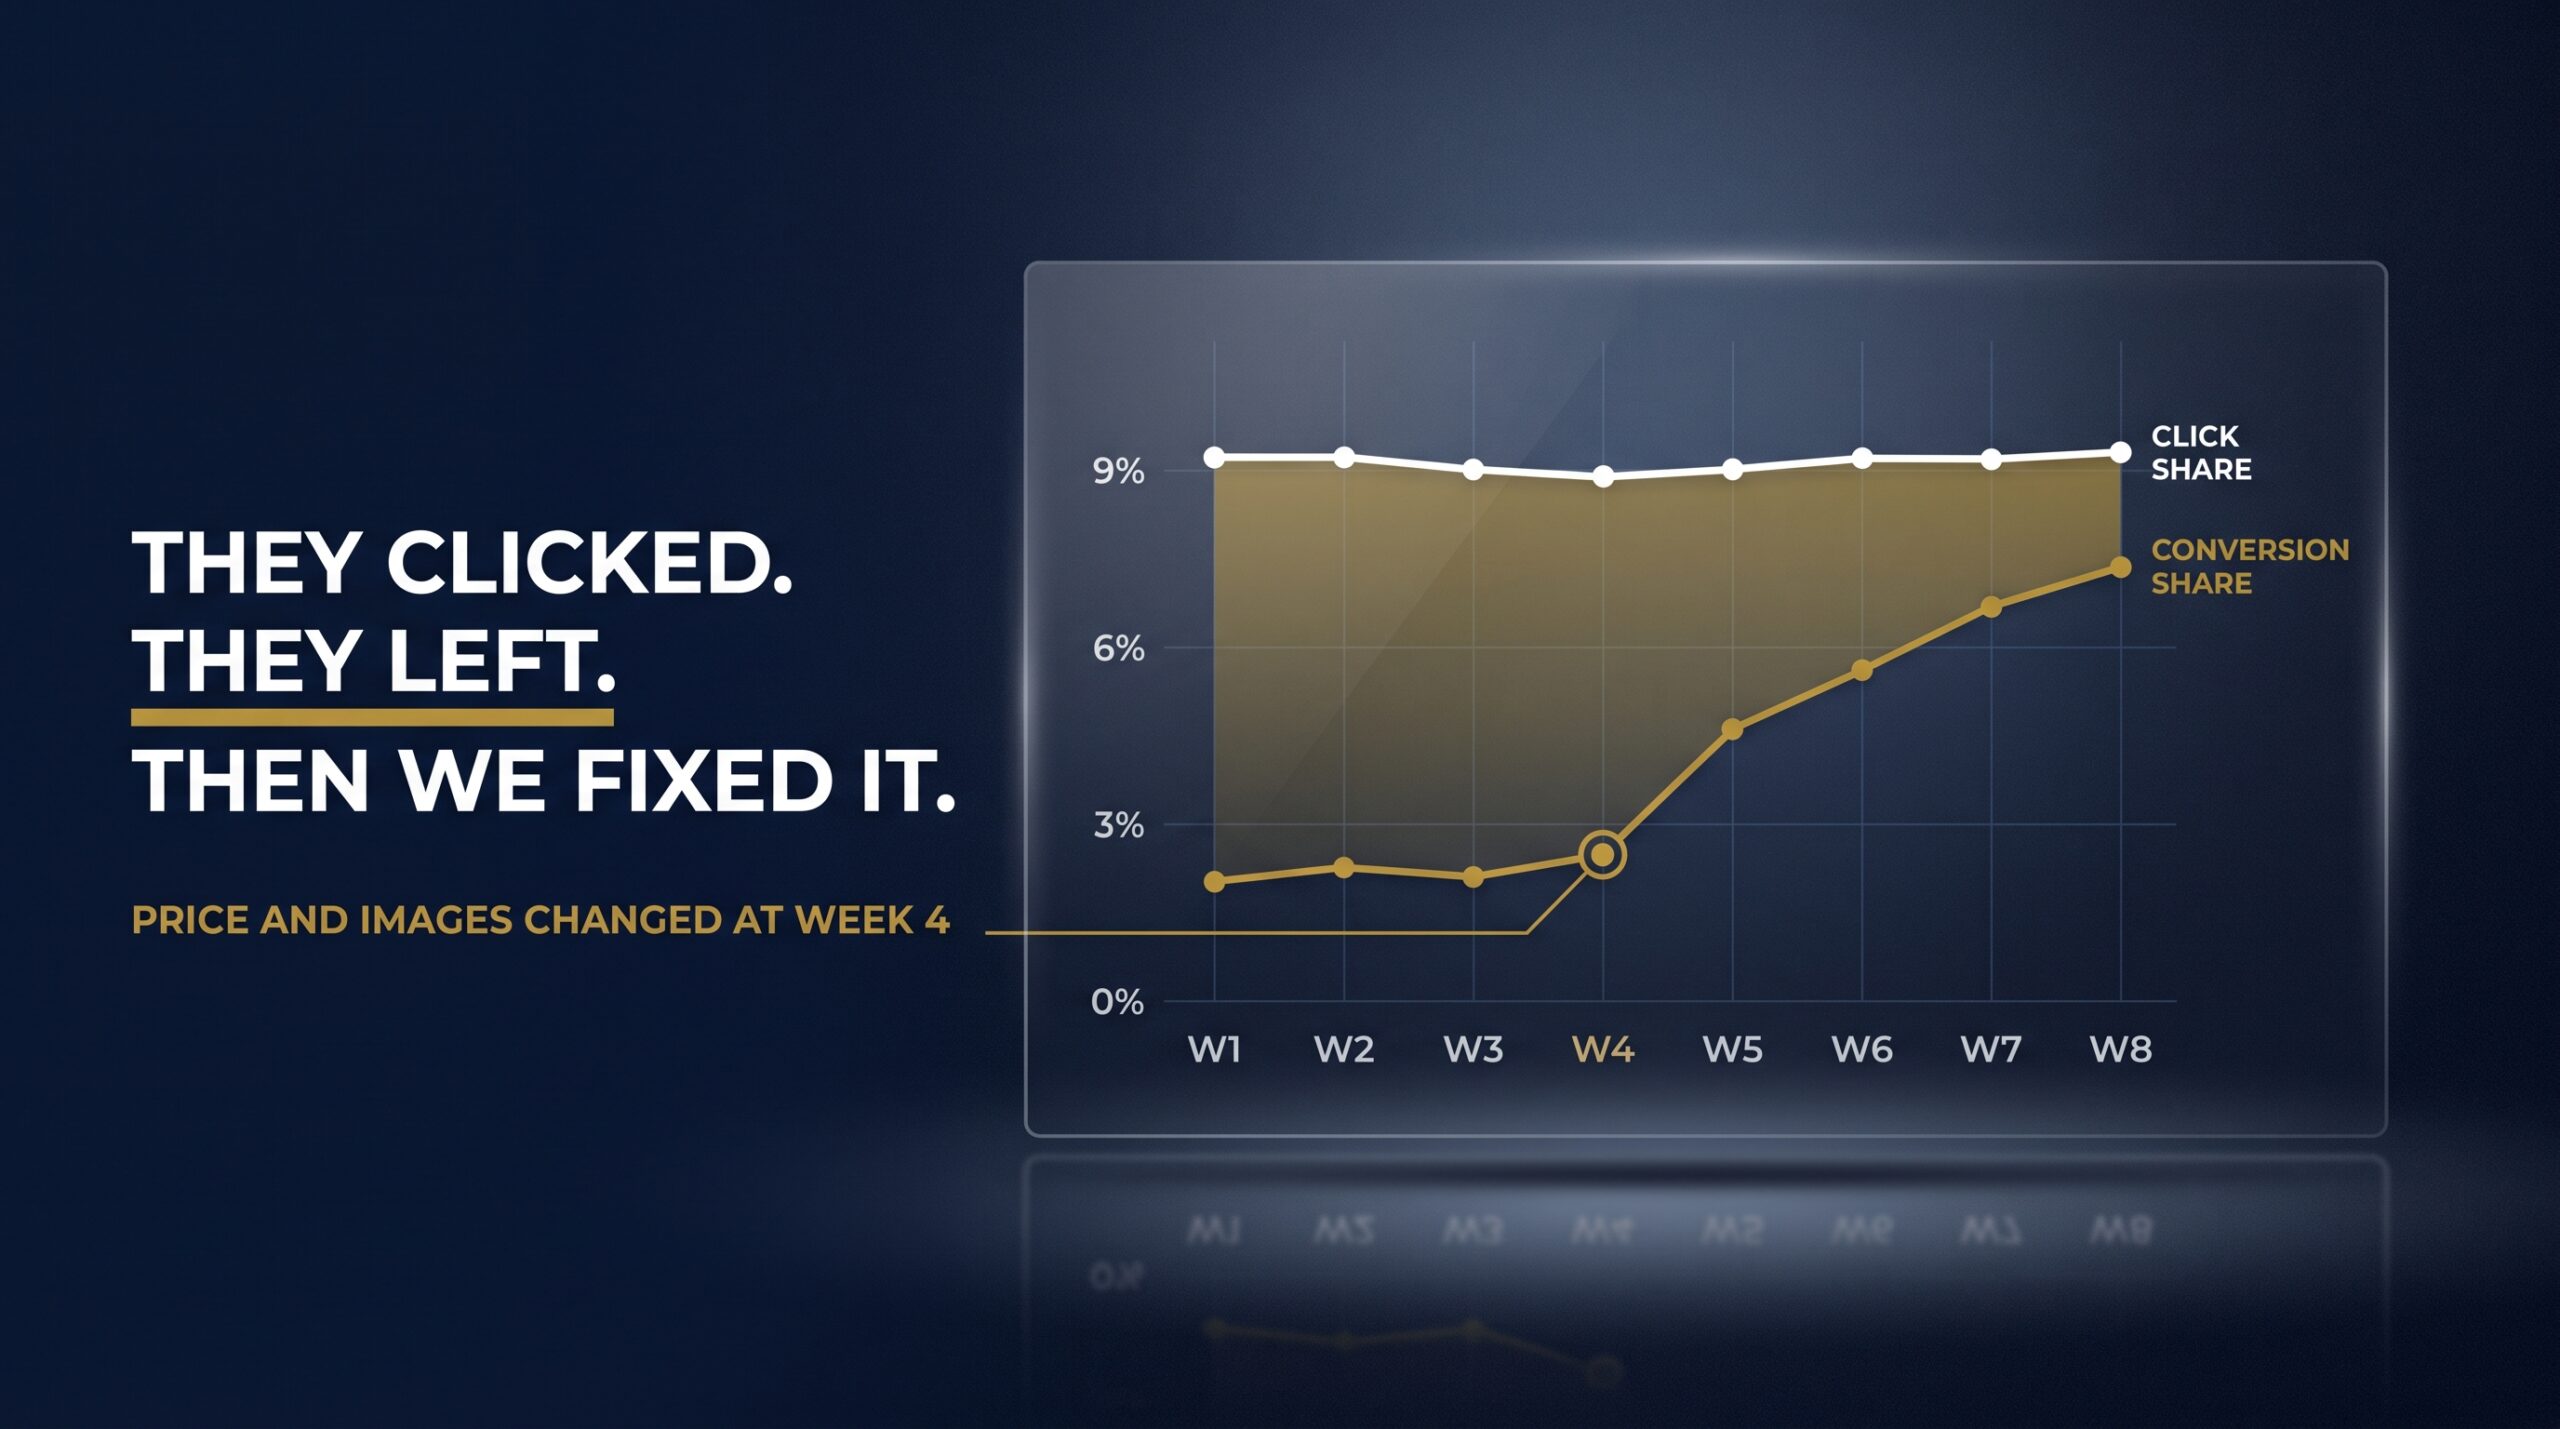
Click share is the portion of clicks on a term that landed on a given ASIN. Conversion share is the portion of resulting purchases. High click share with low conversion share means shoppers arrive and leave. Low click share with high conversion share means the few who find you buy readily, and you simply need more of them.
Telling a listing problem from an advertising problem
That second pattern is an advertising and ranking problem: raise bids, widen placements, improve organic position. The first pattern is a listing problem: price, images, reviews, or a mismatch between what the title promises and what the product is. Kavita Desai in Surat found 9% click share against 2% conversion share on her wall clock; a price trim and three new lifestyle images pulled conversion share to 7% within five weeks.
Watching share move week after week
A single week’s share figure is noise. Four consecutive weeks is a trend you can act on. Log both numbers for your top five terms every Monday and the story writes itself by the end of the month.
Studying the Rivals Shoppers Compare You To
Your competitors are not who you think they are. Amazon knows exactly who shoppers weighed you against.
Reading the item comparison report
This report shows the five products most often viewed on the same day as yours. Some will surprise you, because shoppers cross category boundaries in ways category managers never do. Treat this list as your genuine competitive set for pricing and content decisions.
Learning from alternate purchase data
The alternate purchase report goes further: it shows what shoppers bought after viewing your product. That is a defeat log, and the most honest feedback Amazon will ever hand you. Sort by percentage and study the top two ruthlessly.
Pricing and content moves that win the toss-up
Vikram Shetty in Bengaluru discovered 31% of shoppers who viewed his protein shaker bought a rival with a wider mouth. He added a size comparison image and a bullet addressing it, and lost-purchase share dropped to 18% over two months. The lesson: most toss-ups are decided by one unanswered objection.
Working out which objection is costing you sales gets faster with a second pair of eyes, which is why the 3-Day Amazon Business Training walks sellers through live listings rather than theory.
Bundling Ideas from What Shoppers Buy Together
Average order value is the cheapest growth available to you, and this report hands you the combinations.
Reading basket combinations for your catalogue
Market basket analysis amazon provides shows the three products most frequently bought in the same order as yours. Some pairings are obvious, some reveal a use case you never marketed. Note the percentages, because a 12% pairing is a business and a 2% pairing is a curiosity.
Designing bundles and virtual bundles that sell
Where the paired item is also yours, create a virtual bundle so both appear as a single buyable offer. Where it belongs to another seller, source or manufacture your own version. Ananya Bose in Kolkata saw 14% of her scented candle orders included a matching diffuser; she launched a bundle and average order value rose from ₹640 to ₹910 in seven weeks.
Pointing Sponsored Display at complementary items
The same data makes excellent ad targeting. Run Sponsored Display against the ASINs that appear in baskets with yours, and against their close substitutes. Intent is already proven, so your cost per acquisition usually behaves better than broad keyword targeting.

Turning Repeat Buyers into Steady Revenue
New customers are expensive. Returning ones are the quiet reason some brands survive a bad quarter.
Reading the repeat purchase behaviour report by ASIN
The repeat purchase behaviour report amazon provides splits unique customers from total orders across a chosen period, per ASIN. Divide one by the other and you have a repeat rate. Run it quarterly, not weekly, because most repurchase cycles are longer than seven days.
Spotting replenishment and subscription candidates
Any product with a repeat rate above roughly 20% is a replenishment product whether you designed it that way or not. Those deserve Subscribe and Save consideration, multipacks, and packaging that reminds people to reorder. Farhan Qureshi in Hyderabad found his coffee filter papers repeated at 34%, launched a three-month pack, and lifted quarterly revenue on that ASIN by 22%.
Fixing products nobody ever orders twice
A consumable with a repeat rate under 5% is telling you something unpleasant about quality, quantity or expectation. Read your three-star reviews alongside that number before reordering stock. Sometimes the fix is the product; often it is a claim the product never matched.
How to Use Amazon Brand Analytics Every Week
Knowing how to use Amazon Brand Analytics matters far less than using it on a schedule you keep.
A thirty minute Monday review routine
Open the dashboard, pull last week’s search terms for your top category, and log click share and conversion share for your five priority terms. Check whether any new ASIN entered the top three. Note one action, and only one. Consistency beats depth here.
The handful of numbers worth tracking monthly
Monthly, review item comparison and alternate purchase percentages, basket pairings above 10%, and your repeat rate by ASIN. Deepa Krishnan in Chennai kept this rhythm for six months across her skincare range and grew organic sessions 44% without increasing ad spend. The lesson: small weekly corrections compound faster than quarterly overhauls.
Mistakes that waste good data
The three costly ones are reading a single week as a trend, chasing high-frequency terms already dominated by entrenched brands, and downloading reports without ever changing a listing. Data you admire is decoration. Data you act on is advantage.
Frequently Asked Questions
What is Amazon Brand Analytics and who can access it?
Amazon Brand Analytics is a reporting suite inside Seller Central showing aggregated shopper behaviour for your category: search terms, competitor click and conversion share, item comparisons, basket combinations and repeat purchase rates. Access belongs to sellers enrolled in Amazon Brand Registry with their listings linked to the enrolled brand. Vendors see a version of these reports too. Once your brand is enrolled and your ASINs mapped correctly, the reports appear automatically.
Is Amazon Brand Analytics free for brand registered sellers?
It is included with Brand Registry enrolment, with no additional subscription charge beyond your Professional selling plan, and Amazon does not tier it by sales volume. What it genuinely costs is the time to read the reports properly and act on what they show, which is where most sellers quietly fall short. Treat that half hour every Monday as a fixed operating cost, the same way you treat your accountant’s fee.
Do I need a registered trademark to access Amazon Brand Analytics?
You need a trademark, though it does not always have to be fully registered. Amazon accepts pending applications filed through its IP Accelerator programme, which lets Indian sellers enrol months earlier than waiting on the full registration certificate. The mark must be held by your selling entity and match the brand name shown permanently on your product and packaging. A logo stuck on with a sticker will not survive the image verification step.
What is search frequency rank in Amazon Brand Analytics?
It is a relative popularity ranking of search terms within a category for a chosen period, where rank 1 is the most searched term. It is not a volume figure, so you cannot claim a rank 100 term gets a specific number of searches. Use it comparatively instead: a term climbing from rank 800 to rank 300 across four weeks signals rising demand, which is far more actionable than its absolute position on any single day.
How do I read click share and conversion share in Brand Analytics?
Click share shows what portion of clicks for a search term went to a particular ASIN; conversion share shows what portion of the resulting purchases it captured. Read them as a pair. High clicks with low conversions points to price, images, reviews or a promise your listing does not keep. Low clicks with strong conversions points to visibility, meaning bids, placements and organic rank deserve your budget rather than your copywriter.
How often is Brand Analytics data refreshed?
Reports update on a regular cycle, with weekly reporting periods available alongside monthly, quarterly and annual views. Expect a short lag between a week closing and its data appearing, so Monday reviews typically cover the week before last. That lag is fine for keyword and share trends, but do not lean on these reports for same-day inventory or pricing calls, where your own business reports move considerably faster.
Can I see competitor sales numbers in these reports?
No, and anyone claiming otherwise is guessing. Amazon shares percentages and shares, never absolute units or rupee revenue for other brands. You will see that a rival ASIN holds 22% click share on a term, not that it sold 400 units. That is still enough to rank competitors by influence, spot who owns a keyword, and decide where your advertising money will meet the least resistance.
Conclusion
The advantage here was never access. Thousands of brand registered sellers can open these reports tomorrow, and most will glance once, feel briefly informed, and change nothing. The ones who pull ahead log five numbers every Monday, notice when a new ASIN muscles into the top three, and make one small correction while the information is still fresh.
Start narrow. Pick your best-selling ASIN, pull its search terms and its alternate purchase report this week, and fix the single clearest gap you find. Do that four weeks running and you will know more about your category than competitors who have been selling twice as long.
If you want that habit built properly, with someone checking your reading of the numbers, come and build your review routine inside the 3-Day Amazon Business Training.

2 Responses
Thanks for sharing..It was something new for me.
very interesting insight Aman, share the video to rashmikalani@gmail.com