
Why Most Indian Sellers Ignore Amazon’s Most Powerful Free Tool
Last March, Vinay Singh from Pune was burning fifty thousand rupees a month on Amazon PPC for his home decor brand. When his ACOS climbed past 45%, he could not figure out why some keywords printed money while others quietly drained his budget. The data he needed was sitting inside his Seller Central account the whole time — free, first-party, completely untouched. He just never opened the Amazon Search Query Performance Report.
If that sounds familiar, you are in good company. Roughly nine out of ten brand-registered sellers either ignore this dashboard or close it within two minutes — not because they do not care, but because it looks intimidating. By the time you finish this article, you will have a repeatable weekly process to surface five to ten high-intent keywords directly from your own Amazon data.
The fifty-thousand-rupee mistake hiding in plain sight
Most sellers obsess over external keyword tools while ignoring the one report Amazon hands them. Tools like Helium 10 and SellerApp are useful, but they estimate. The SQP report is the actual record of what your shoppers typed and what they did next.
Why nine out of ten brand-registered sellers never open the dashboard
The SQP interface was not designed for new sellers. The default view drops you into a thousand-row spreadsheet with columns labelled Search Query Score, Impression Share, Click Share, and more — nothing tells you which row to look at first. The information is gold; the packaging is intimidating.
What you will walk away with
A three-filter shortcut to find high-intent keywords in fifteen minutes, a diagnostic method to read where shoppers drop off, and a Monday-morning ritual that takes less time than a chai break.
What Is the Amazon Search Query Performance Report (And Who Can Access It)
The Amazon Search Query Performance Report — usually shortened to the Amazon SQP report — is a first-party analytics tool inside Amazon Brand Analytics. It shows the exact search queries shoppers typed into Amazon, how many times your products appeared, how many clicked through, added to cart, and actually bought. Think of every other keyword tool as a forecast; the SQP report is the weather itself — what actually happened on Amazon’s own search results pages.
SQP report in plain English
The dashboard tracks search query volume, impressions, clicks, cart adds, and purchases for every meaningful keyword tied to your brand. For each metric, you see both the total market number and your brand’s share. If a keyword had ten thousand searches and your products earned a thousand impressions, your impression share is 10%. The same breakdown applies at every funnel stage, which is where the diagnostic power lives.
Who qualifies: the brand registry requirement
Access is limited to sellers enrolled in Amazon Brand Registry with a Brand Representative role. Generic resellers, wholesalers without a registered trademark, and Vendor Central accounts do not get access. For Indian sellers, you need a registered or pending Indian trademark and an Amazon.in seller account tied to the brand.
How to access it in Seller Central in three clicks
Log into Seller Central, switch the marketplace selector to Amazon.in, then navigate to Brands → Brand Analytics → Search Analytics → Search Query Performance. Choose Brand View or ASIN View, set your reporting range to weekly, monthly, or quarterly, and the dashboard populates.
The 8 SQP Metrics That Actually Matter
The SQP report shows around twenty columns by default, but only eight drive real decisions. They come in pairs — a market-level number and a brand-share number — and the gap between them is where the insight lives.
Search Query Volume vs Search Query Score: the two metrics sellers confuse most
Search Query Volume tells you how many times shoppers searched that exact phrase during the period. The Amazon Search Query Score is the slippery one — a relative score for how significant a keyword is to your specific brand or ASIN versus other queries. A high Score means the keyword is disproportionately important for you, not that it has high volume. Treat the Score as a prioritisation hint and the Volume as raw demand.
Impression share, click share, cart add share, purchase share
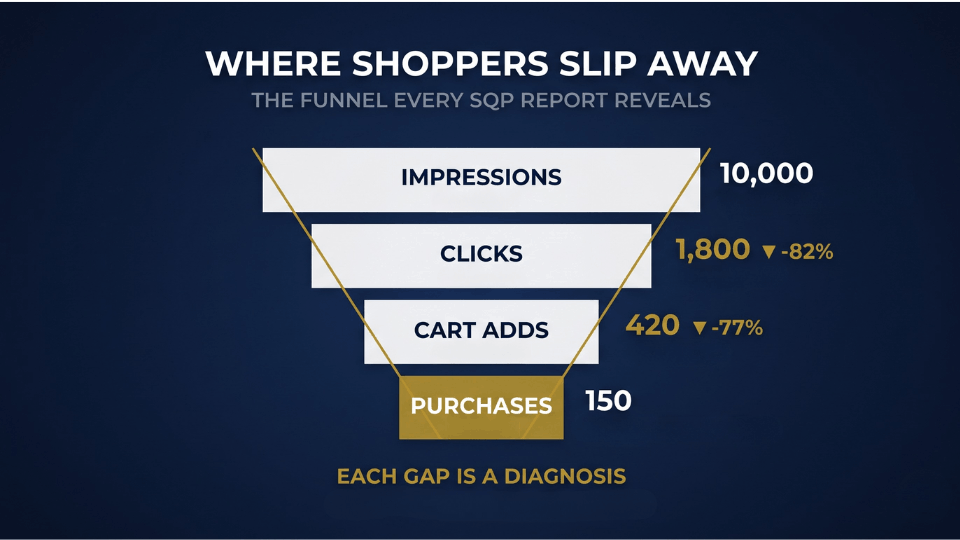
These four share metrics form the funnel. Impression share tells you how often your listings showed up. Click share tells you how often shoppers chose you over a competitor. Cart add share and purchase share continue the journey down. What you want to read is whether your share grows or shrinks as you move down — that pattern reveals where you are winning or losing.
Brand View vs ASIN View: when to use each
Anjali Menon from Kochi runs a wellness brand with twelve SKUs. She uses Brand View on Monday for catalog-wide patterns, then switches to ASIN View when one product feels off. Last quarter she found her bestselling turmeric capsule had 14% impression share but only 4% click share for its top keyword. The Brand View hid that gap; the ASIN View made it impossible to ignore.
How to Find High-Intent Keywords Fast Using SQP
Finding high intent keywords amazon sellers actually convert on is not magic — it is filtering. The three-filter shortcut below works on any ASIN, in any category, in under fifteen minutes.
The high-intent keyword definition Amazon sellers should use
A high-intent keyword on Amazon is one where shoppers know what they want and they buy. In SQP terms, that means three things together: meaningful search volume, an above-average purchase rate, and a purchase share that exceeds the impression share. The third part matters most. If your impression share is 5% but your purchase share is 12%, shoppers are choosing you at a rate that beats your visibility — a clear buying signal.
The three-filter shortcut
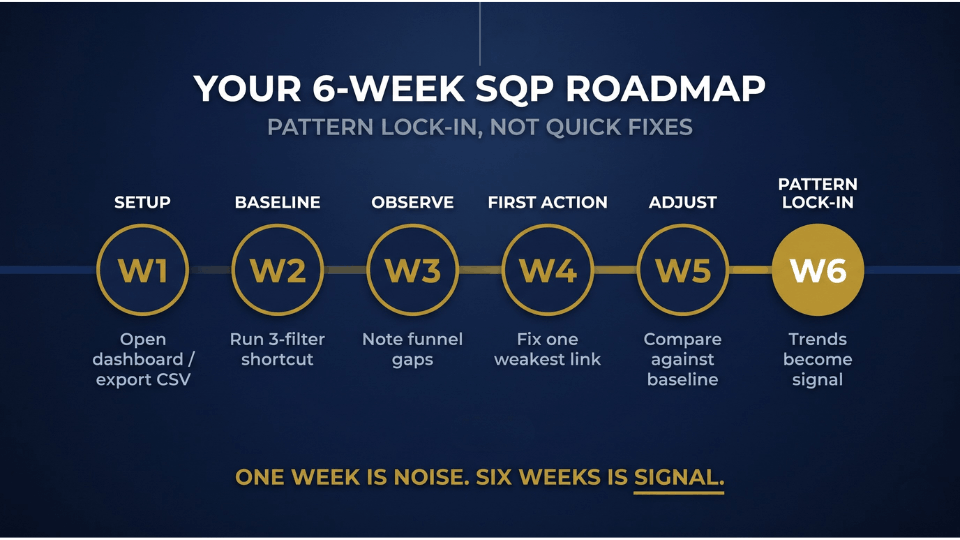
Export your SQP report to a spreadsheet. First, sort by Search Query Volume from highest to lowest. Second, filter out any row where purchases is zero. Third, flag every remaining keyword where your purchase share is higher than your impression share. Those flagged rows are your high-intent keywords — they already convert above their fair share and just need more exposure.
A live example from Jaipur
Meera Agarwal from Jaipur runs an ayurvedic skincare brand. She ran this filter last December on her top-selling ubtan powder ASIN. The first sort surfaced about 380 rows with at least one purchase; the third filter shrank that to 18 high-intent keywords — seven she had never bid on in PPC. She added them to her sponsored brand campaign at a moderate bid. Within six weeks, her organic rank improved on five, and her conversion rate on that ASIN climbed from 9.4% to 12.8%.
Reading the Funnel Gaps: Where You Are Losing Sales
Finding good keywords is half the battle. The other half is understanding why some keywords leak. The SQP report makes this almost surgical.
High impressions, low clicks means your main image or title is the problem
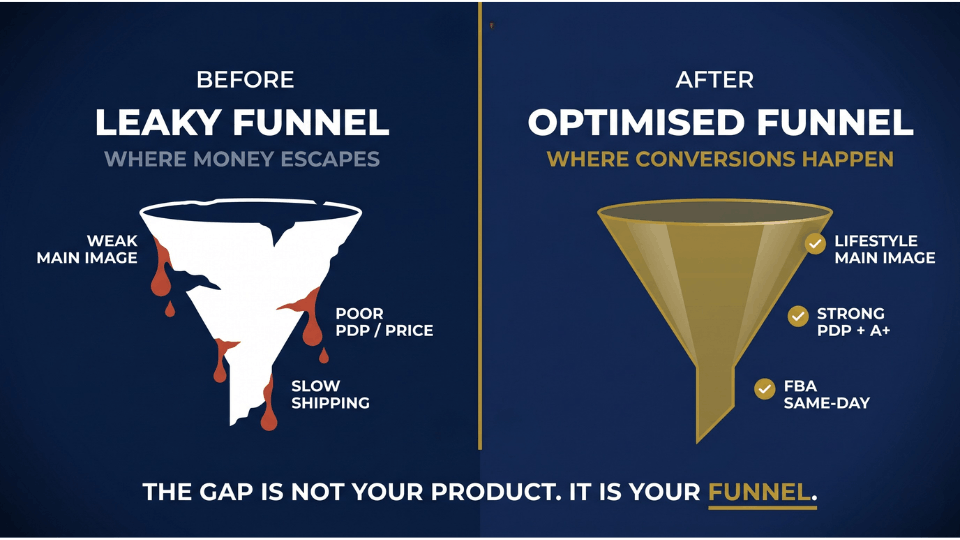
When a keyword has healthy impression share but a click share that lags behind, shoppers see you and scroll past. The fix is almost always in the main image, the title, or the price point. Rohan Bhatia from Surat had a kitchen organiser ASIN with 18% impression share and only 5% click share. He swapped his cluttered main image for a clean lifestyle shot, and click share climbed to 11%. If the image is the culprit, our guide to better Amazon product photography covers the fix.
Strong clicks but weak cart adds means your PDP is failing
If shoppers click but do not add to cart, they reached your detail page and decided against you there. Check your bullets, A+ Content, secondary images, price, and reviews count. Anything visible on the PDP is fair game, and the fix often takes longer than an image swap.
Cart adds without purchases means a competitor or shipping speed problem
Shoppers who add to cart and never check out are usually comparison shopping or stalling on shipping speed. If you are FBM, this gap often closes when you switch to FBA — Same-Day or 1-Day shipping is a major closer in metro India. If you are already FBA, the issue is likely price or a competitor’s better offer.
Five Workflows to Run on Your SQP Report This Week
The sellers who get the most out of SQP treat it like a weekly tool — fifteen minutes, every Monday, the same five workflows. Run them in order the first time, then pick whichever matches your question that week.
- Find your underexposed winners. Filter for keywords with high purchase rate but low impression share. These already convert above average — they just need more visibility through PPC or listing improvements.
- Identify ad-spend leaks. Filter for high click share but low purchase share. These keywords burn budget without converting — lower bids, pause them, or rework the PDP. Mumbai apparel seller Karan Joshi cut wasted spend by 38% in one month using just this filter. Our breakdown of the costliest Amazon PPC mistakes goes deeper.
- Spot product expansion opportunities. Look for high-volume keywords in your category where your brand has zero impression share. These gaps point to new variations, bundles, or sub-categories worth testing.
- Audit branded versus unbranded keywords separately. Branded queries always convert higher because the shopper already wants you. Mixing them hides the real story of your unbranded performance.
- Build a Monday morning review ritual. Block fifteen minutes every Monday. Pull the previous week’s SQP report, run filters one and two, note three actions, close the dashboard.
The point is consistency, not depth. For what to track beyond search, see our guide to the key metrics in Seller Central.
Common Mistakes Indian Sellers Make with SQP Data
The SQP report is powerful precisely because it shows real customer behaviour. But that same precision becomes a trap if you misread the rules behind the numbers. Three mistakes show up again and again.
Treating SQP like a sales report
The SQP report is a search behaviour report, not a sales report. It uses a strict 24-hour attribution window — only purchases within a day of the search count — and excludes direct-to-PDP traffic and off-Amazon clicks. If your SQP purchase number does not match your Business Reports number, that is normal. They measure different things.
Comparing branded and unbranded keywords side by side
Branded keywords — your brand name plus a product term — always show higher CTR and conversion rate, because the shopper already wants you and is just navigating. If you average branded and unbranded data together, you will think your unbranded listings are stronger than they are. Always filter by brand name first.
Acting on a single week of data
One week of SQP data is noise. Trends only show up over four to six weeks. Sellers who panic over one bad week and overhaul their listing usually undo gains they spent months building. Watch the pattern, not the snapshot.
Tools That Make SQP Analysis Easier
The native dashboard does the job, but it is slow and the export is clunky. As your business grows, you will want a layer on top that stores history, flags anomalies, and visualises trends.
The native Seller Central export is free and gives you the raw CSV with weekly, monthly, or quarterly ranges — fine for sellers running one or two ASINs. Third-party SQP dashboards from tools like Helium 10, SellerApp, MerchantSpring, and Autron layer historical trends, alerts, and competitor benchmarks on top, which helps once you cross fifty SKUs. The Amazon Selling Partner API now allows fully automated SQP pulls — the right path if you have a developer or work with an agency that builds custom dashboards.
Pick the option that matches your stage. A new brand with three ASINs does not need API access; a seven-figure brand with eighty SKUs probably does. For most readers, the middle path with a third-party tool is the sweet spot. If you are not yet brand-registered, see our explainer on whether you need a trademark.
FAQ: Amazon Search Query Performance Report
What is the Amazon Search Query Performance Report?
It is a first-party Brand Analytics report inside Seller Central showing search query volume, impressions, clicks, cart adds, and purchases for the top thousand keywords tied to your brand, alongside your brand’s share of each metric.
How do I access the Search Query Performance dashboard in Seller Central?
Set the marketplace to Amazon.in, then go to Brands → Brand Analytics → Search Analytics → Search Query Performance. You need an active Brand Registry enrolment and a Brand Representative role.
What is the difference between Search Query Volume and Search Query Score?
Volume is the raw count of how many times shoppers searched that phrase. Score is a relative ranking Amazon assigns to indicate how significant the keyword is to your brand. Use Volume for demand sizing and Score for prioritising attention.
What is a high-intent keyword on Amazon?
A high-intent keyword is one where shoppers know what they want and buy. In SQP terms, it shows meaningful search volume, an above-average purchase rate, and a purchase share that exceeds the impression share — three signals the keyword converts above its fair share.
How do I use SQP data to improve my listing and PPC?
Use the funnel gaps. Low click share with high impression share points to a main image or title fix. Low cart add share points to PDP issues. Low purchase share with high cart add share usually means shipping speed or competitor comparison.
Is the SQP report available for sellers on Amazon.in?
Yes. Indian sellers enrolled in Brand Registry for Amazon.in get full access. Set your marketplace selector to Amazon.in, otherwise the dashboard may default to the US marketplace.
How often should I check the Search Query Performance report?
Weekly is the sweet spot. The data refreshes weekly, and a fifteen-minute Monday review keeps you ahead of trends. For strategic decisions like product expansion, look at monthly or quarterly ranges.
Can SQP data replace third-party keyword research tools like Helium 10?
Not entirely, but it is more accurate for keywords already tied to your brand. Third-party tools remain useful for discovering keywords you do not yet rank for. Use SQP for your existing universe and Helium 10 for new territory.
Conclusion
The Amazon Search Query Performance Report is the closest thing Indian sellers have to a sales crystal ball — and most never touch it. Free, first-party, refreshed weekly, one menu click away inside Seller Central. The sellers who win in 2026 will not be the ones with the most expensive tools. They will be the ones who read their own data more carefully than their competitors read theirs. Apply the three-filter shortcut once. Build the Monday ritual. Watch your funnel gaps tell you exactly what to fix next.
If you want a structured system to turn data like this into a real growth plan for your Amazon brand, join our 3-Day Amazon Business Training — the exact frameworks Indian brand owners use to scale past their first crore. Your data is already telling you the story. Time to read it properly.
