
Sneha Kulkarni from Nashik had a purchase order open on her laptop and one number guiding it. Her guide was a single Amazon BSR India figure: a competitor’s stainless-steel lunch box ranked #850 in Home & Kitchen. She typed that rank into a free online calculator, which promised roughly 1,000 units a month. That meant a ₹3.8 lakh order for 2,000 units headed to an FBA warehouse.
Then a seller friend asked one awkward question: “Is that calculator even built for Amazon.in?” It wasn’t. Reading Amazon BSR in India the way US guides teach it is one of the fastest ways to overstock.
This guide shows you what the rank means, how to check it, how to turn it into a realistic monthly sales range for Indian categories, and the snapshot traps that make one day’s rank lie. By the end, you’ll know whether 2,000 units is a smart order or a storage-fee problem.
Amazon BSR India Basics: What the Rank Really Means
BSR meaning in Amazon: a rank, not a sales count
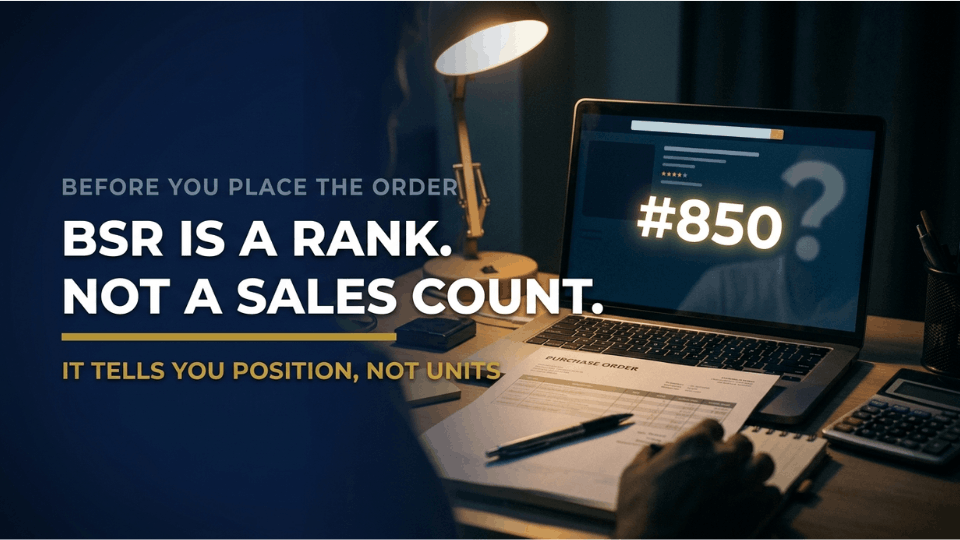
Best Sellers Rank is Amazon’s way of comparing how well a product sells against everything else in the same category. Rank #1 is the top seller, and a lower number always means stronger recent sales. What BSR never tells you directly is how many units moved. It’s a position in a queue, so your rank can improve while your sales stay flat, simply because a competitor slowed down.
What moves your BSR (and what doesn’t)
BSR is driven by sales alone, with recent sales weighted more heavily than older ones. Your star rating, review count and page views don’t move it directly. Units sold through Sponsored Products count exactly like organic orders, which is why a heavy ad push can flatter a rank for a while.
Imran Qureshi from Lucknow learned this the slow way. He spent a month chasing reviews for his kitchen organisers, convinced his 4.6-star rating would lift his rank. Nothing changed until he fixed a two-week stock gap and ran a 10% coupon.
Why Amazon.in keeps its own scoreboard
Every Amazon marketplace calculates BSR separately. A rank on Amazon.com tells you nothing about Amazon.in, and neither do sales charts built from US data.
How to Read Amazon BSR on Any Amazon.in Listing
How to check BSR on Amazon in under a minute
Open any product page on Amazon.in and scroll past the bullet points to the Product information or Product details section. The layout shifts by category, but you’ll find a Best Sellers Rank line with one or two numbers. In the app, it sits in the same details block, sometimes behind a “See more” tap. Browser extensions like Helium 10 show the rank and its history right on the page.
Main category rank vs subcategory rank: which to read
Most listings show two ranks: one in the main category, such as Beauty, and one in a narrower subcategory, such as Hair Oils. The main category rank is the better guide to volume because it compares the product against a much larger pool. The subcategory rank tells you how it stacks up against direct rivals.
Kavya Reddy from Hyderabad nearly dropped a herbal hair oil idea because a competitor ranked #9,400 in Beauty. She’d missed the #38 in Hair Oils just below it, a sign of steady, specific demand in a niche she could realistically win.
Why variations often show one shared rank
For products sold in several sizes or colours, the rank can reflect sales across the whole variation family, so one shade may look stronger than it is. Check child listings in a tool before trusting the number.
Why the Same BSR Means Different Sales by Category
Category size changes everything
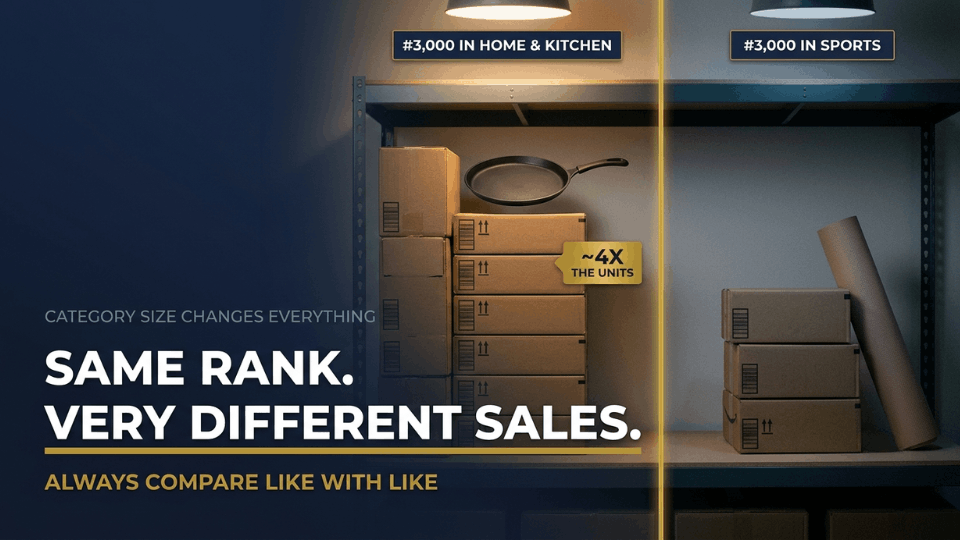
A rank of #1,000 only means 999 products sold more recently. In Home & Kitchen, that can mean several hundred units a month; in a smaller category, a few dozen. Before you judge any number, ask how big the pond is.
The subcategory trap: #2,000 here, #20,000 there
The same product can show #2,000 in a subcategory and #20,000 in its main category. Comparing one competitor’s subcategory rank with another’s main category rank leads to confident, completely wrong conclusions. Always compare like with like.
Why US BSR charts mislead Indian sellers
Most BSR-to-sales tables online are built from Amazon.com data, where each category has far more shoppers. Plug an Amazon BSR India figure into one of those charts and the estimate comes out inflated, often several times over.
Arjun Menon from Kochi was choosing between a yoga mat ranked about #3,100 in Sports, Fitness & Outdoors and a cast-iron tawa at #3,000 in Home & Kitchen. The ranks looked identical. When he checked both in Helium 10’s Xray, the tawa was selling roughly four times as many units. He launched the tawa.
To see these differences for yourself, grab our BSR 30-Day Tracking Sheet. Log three competitors’ ranks daily for a month, and the pattern becomes obvious before you commit to inventory.
What Is a Good BSR on Amazon for Indian Sellers?
Rough BSR bands and what they signal
In the big Amazon.in categories, a main category rank under 1,000 signals strong daily sales. Between 1,000 and 10,000 usually means steady, healthy demand. From 10,000 to 50,000, products sell regularly but in small numbers, and beyond 100,000 sales tend to be occasional. Category size shifts every band.
Good rank, bad business: when BSR hides thin margins
A strong rank can be bought. Heavy PPC spend and deep discounts both push units through and improve BSR, while profit quietly disappears into ad costs and FBA fees.
Debashish Roy from Kolkata found a ₹299 product where every top seller ranked under 2,000. After referral fees, FBA fees, GST and the PPC needed to compete, his margin worked out to ₹18 a unit. He walked away and launched a ₹999 product in a niche where the leaders sat between 8,000 and 15,000. Fewer sales, but each one paid.
When a great BSR means you should stay away
If every top-ten listing ranks under 2,000 with thousands of reviews each, demand is real but the door is mostly shut. A slightly weaker rank with beatable listings is often the better bet for a new brand.
Amazon BSR to Sales: Realistic Ranges for India
Why Amazon.in volumes run lower than US charts
Amazon.in has fewer shoppers per category than Amazon.com, so the same rank simply represents fewer units. Reading Amazon BSR in India needs ranges built for Indian categories, not converted US ones.
Indicative monthly ranges for four big categories
The table below gives indicative monthly unit ranges for main category ranks on Amazon.in. These are working estimates, not Amazon data, and they shift with seasons. Use them for a first read, then confirm with a tool and your own sales history. (These numbers are for illustrative purposes only).
| Main category | BSR 1,000 | BSR 5,000 | BSR 10,000 | BSR 25,000 | BSR 50,000 |
|---|---|---|---|---|---|
| Home & Kitchen | 250–400 | 90–150 | 50–90 | 20–40 | 8–18 |
| Beauty | 200–350 | 70–120 | 35–70 | 15–30 | 5–12 |
| Health & Personal Care | 180–300 | 60–110 | 30–60 | 12–25 | 4–10 |
| Sports, Fitness & Outdoors | 120–220 | 40–80 | 20–40 | 8–18 | 3–8 |
Anjali Bhatt from Ahmedabad saw a home fragrance competitor at about #3,200 in Home & Kitchen. A US calculator put it at 600 units a month. Her own diffuser, hovering near the same rank, was selling around 180, which sits right inside the Indian range.
How festive sales shift the whole curve
During the Great Indian Festival and Prime Day, nearly every product sells more, so the same rank stands for far more units. Ranges built from sale-week data overstate demand for the rest of the year, so build yours from normal months.
How to Estimate Amazon Sales from BSR, Step by Step
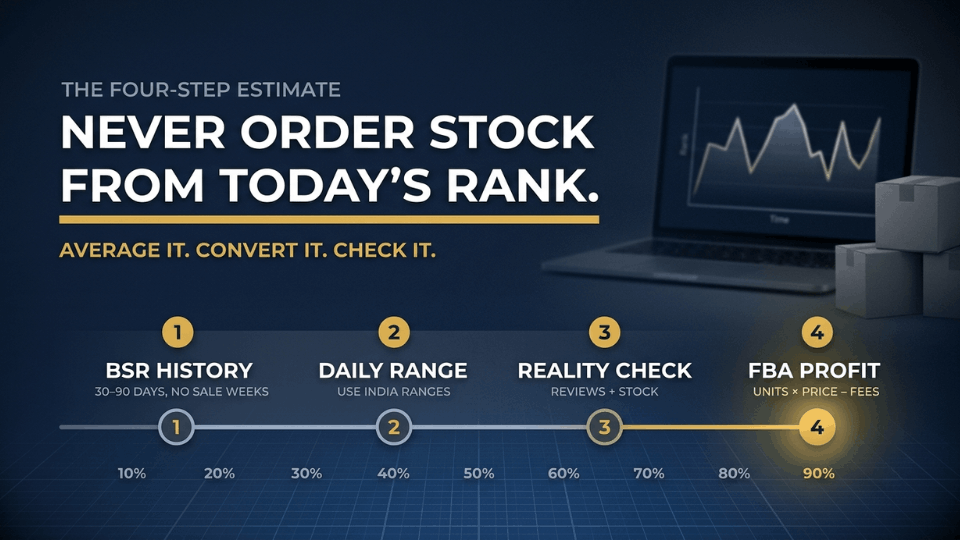
Step 1: Pull 30–90 days of BSR history
Never estimate from today’s rank. Open the product’s Keepa graph or your tool’s history and note the average main category BSR over at least 30 days, ideally 90. Leave sale weeks out when you calculate it.
Step 2: Convert the average BSR to a daily range
Find the nearest ranks in the India table and read across, estimating in between if your number falls between two columns. Divide the monthly range by 30 for a daily figure. As a cross-check, count how often the rank jumps sharply in the history graph, because each jump usually means at least one sale.
Step 3: Sanity-check with reviews and stock movement
Check how many reviews the listing gained in recent months. If your estimate says 300 units a month but reviews barely move, your number is probably high. Where a tool shows stock levels, falling inventory is the cleanest confirmation.
Step 4: Turn units into revenue and FBA profit
Multiply units by selling price for revenue, then subtract referral fees, FBA fees, GST and a realistic PPC budget. What’s left per unit decides whether the product is worth launching.
Harpreet Gill from Ludhiana ran this for gym gloves. A competitor’s 60-day average BSR was about 1,900 in Sports, Fitness & Outdoors, which pointed to 90–130 units a month. He sent 220 units to FBA to cover two months, and they sold through in about seven and a half weeks.
To speed this up, use our Product Validation Scorecard, which puts BSR, review growth and margin side by side for a clear go or no-go.
Amazon BSR India Traps: Why One Day’s Rank Lies
How often does Amazon update BSR?
According to Helium 10, ranks for the top 10,000 products in a category refresh hourly. Those between 10,000 and 100,000 refresh daily, and ranks beyond that may update only monthly. So an Amazon BSR India reading of #60,000 may be showing yesterday’s position, not today’s.
Sale-day spikes and deal-driven ranks
A Lightning Deal or festive sale can push a product into the top few hundred for days, reflecting a discount rather than normal demand.
Meenakshi Sundaram from Madurai spotted a brass pooja set at #320 during Diwali week and launched her own in January. Her first month brought about a quarter of the sales she’d planned for. The rank she’d seen belonged to the festival, not the year.
Stockouts and the FBA restock rebound
When a competitor runs out of stock, their rank worsens even though demand hasn’t changed. Recovery after restocking can take days, so check whether a listing is unavailable before reading a sudden slide as a falling market.
Calibrate BSR with Your Own FBA Sales Data
Build a private BSR-to-sales map from Business Reports
As a private-label seller, you have data no calculator does: your own ASIN’s rank next to your real units. Log your main category BSR daily and pull units ordered from Business Reports. After 60 to 90 days, you’ll know what an Amazon BSR in India of #4,000 means for your category.
Vikram Rathore from Jaipur did this with his cotton bedsheets for 90 days. His competitor estimates now land within about 20% of reality, close enough to plan FBA shipments with confidence.
Amazon sales estimator tools: which work for India?
Helium 10’s Xray gives quick unit estimates on Amazon.in search results.
A 15-minute weekly BSR routine
Every Monday, log the weekly average rank for three key competitors and your own ASINs, noting any sale, stockout or price change. Over a quarter, that habit becomes the most accurate sales estimator you’ll own.
Frequently Asked Questions
What is a good BSR on Amazon?
It depends on category size. In large Amazon.in categories, a main category rank under 1,000 signals strong daily sales, and under 10,000 usually means steady demand. A good BSR for your business also leaves a healthy margin after FBA fees and ad spend.
How do you estimate monthly sales from BSR?
Take the product’s average main category BSR over 30 to 90 days, skipping sale weeks, and match it against India-specific ranges for that category. Sanity-check with review growth and stock movement, then refine using your own rank-to-units history from Business Reports.
How often does Amazon update BSR?
Helium 10 says ranks refresh hourly for the top 10,000 products in a category and daily for those between 10,000 and 100,000. Beyond that, ranks may update only monthly, so always check history instead of one reading.
Is BSR the same on Amazon India and Amazon US?
No. Each Amazon marketplace calculates BSR separately, so a product’s rank on Amazon.com has no connection to its rank on Amazon.in. Amazon.in categories also have smaller volumes, so never use a US BSR chart to estimate Indian sales.
Can a product have a good BSR but still be unprofitable?
Yes. Discounts and heavy PPC can push a product to a strong rank while referral fees, FBA fees, GST and ad costs eat the margin. Always calculate profit per unit alongside the rank before calling a niche attractive.
Do PPC sales improve BSR?
Yes. Units sold through sponsored ads count toward BSR exactly like organic sales, which is why new launches with big ad budgets can show impressive ranks early. Look for competitor ranks that hold steady over months before trusting the demand.
Why did my BSR suddenly disappear?
The two most common causes are a lost browse node, where the listing drops out of its category, and the product being wrongly flagged as adult. Check your category assignment first, then open a case with Seller Support.
Conclusion
A single BSR number is a photograph. Inventory decisions need the film: how that rank behaves over weeks, in the right category, measured against Indian volumes. Read Amazon BSR in India that way and product research stops feeling like a gamble.
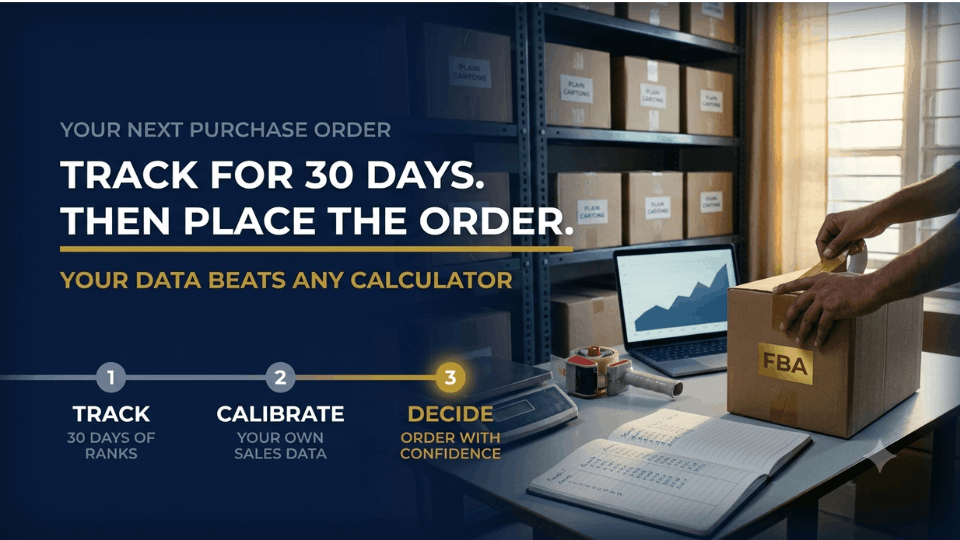
Start small. Track three competitor listings for 30 days, estimate their sales before your next order, then compare those estimates with your own FBA data.
If you want a clear system for validation, pricing and launch planning, join our 3-Day Amazon Business Training. Your next purchase order, and your warehouse bill, will thank you.
