
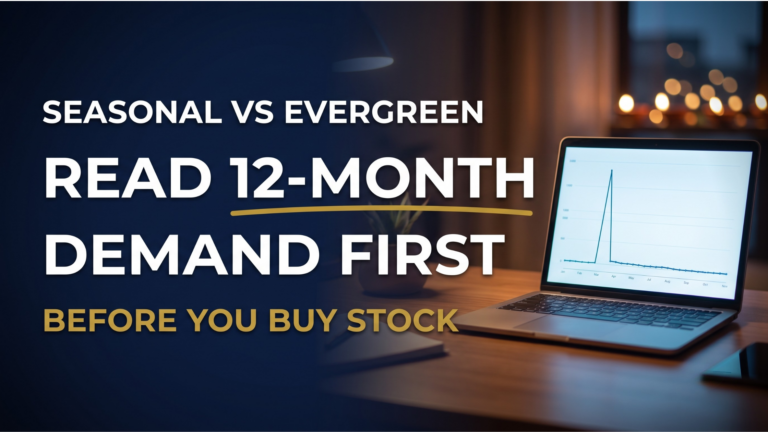
Nandini Iyer from Madurai watched her first Amazon order fly off the shelves. She had launched decorative LED diyas three weeks before Dhanteras, and within days her ranking climbed, her ads printed money, and the dashboard glowed green. She read that surge as demand and reordered hard, sinking nearly four lakh rupees into a second shipment. By December the diyas sat frozen, and she was staring at the whole seasonal vs evergreen products amazon question she had never stopped to ask.
Nandini did not pick a bad product. She misread the picture. That debate is really one question hiding underneath: does this thing sell all year, or does it sell for six weeks and then vanish? A single festive spike looks identical to real demand if you only glance at one month. This post is about reading the full twelve-month curve before you commit a single rupee to stock, so the spike works for you instead of burying you in diyas.
The One-Spike Trap That Kills First-Time Sellers
The trap is simple and it catches smart people. You see a product selling, you feel the urgency, and you order against the peak instead of against the year. What Nandini missed is that a festive surge compresses several normal months of volume into a handful of weeks. If you buy twelve months of stock to feed a six-week window, roughly ten of those months of inventory have nowhere to go.
This is where the language trips sellers up. Category labels lie to you. A product sitting in “home decor” or “kitchen” tells you nothing about when it sells, because a coffee mug is technically a kitchen item yet its demand doubles every December. The honest signal is the shape of the demand curve, not the aisle the product lives in. A flat or gently rising line means the product earns its keep month after month. A sharp eight to ten week hump means you are buying into a countdown.
You have already done the hard early work if you have read our earlier pieces on picking a niche and running a quick 48-hour validation. But validation answers whether people will buy. It does not tell you when they buy or how much across a year, and that timing is exactly what your purchase order needs to survive. Reading the curve is the missing step between “this could sell” and “here is how many units to order.”

What the 12-Month Demand Curve Actually Tells You
Once you look at a full year of data, most products fall into one of four shapes, and each asks something different of you. A flat line is evergreen: steady demand you can restock on autopilot. A seasonal hump spikes hard around one window and flatlines the rest of the year. A rising trend climbs across years, the profile you want if you get in early. A fading fad shot up once and is now sliding, the one to walk away from no matter how good last month looked.
The smartest profile for a nervous first-timer is the hybrid, and it answers a question sellers ask constantly: can a product be both seasonal and evergreen? Yes, and those are often the safest bets. Think of a gift-boxed spice set that sells modestly all year but jumps during the festive and wedding seasons. The year-round baseline quietly absorbs any over-order, so a timing mistake stings instead of sinking you.
The last thing the curve reveals is whether a jump is a real season or a one-off. Vikram Bhosale from Nashik nearly bet his whole budget on a viral kitchen gadget after seeing one enormous spike, until he pulled a longer view and realised the spike had never repeated. A genuine season shows the same month peaking across three or more years. A single unrepeated jump is a fad, and a fad belongs on your third launch, never your first.
How to Read Google Trends for Product Research
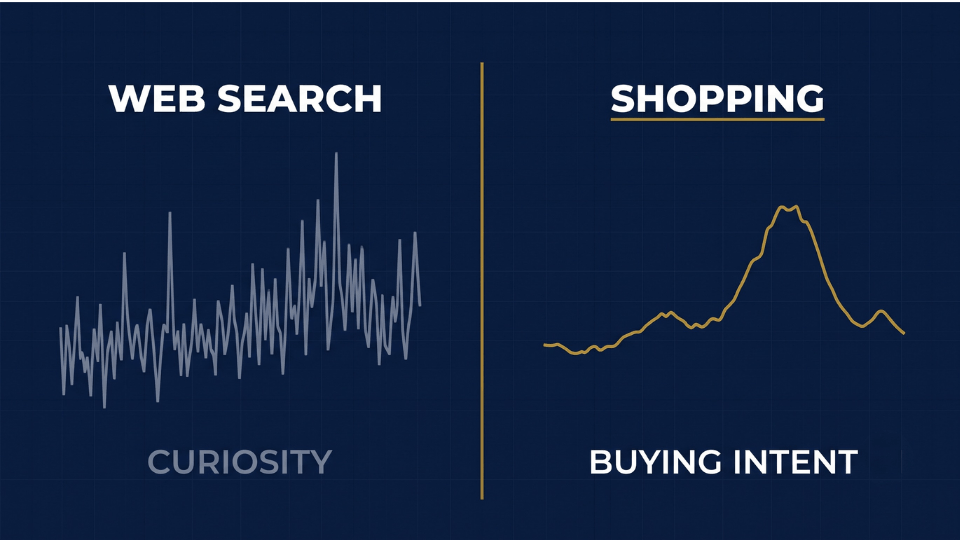
Google Trends is free and most sellers use it wrong. The default view is Web Search, which mixes together blog research, news, and pure curiosity, so a line can spike simply because people are reading about a thing rather than buying it. The fix takes one click: switch the filter to Shopping. Now you are watching people who are comparison-shopping with real intent. When you learn how to read google trends for product research this way, the noise falls away and the buying signal stands out.
The second mistake is looking at only twelve months. One year cannot tell you whether a peak is a reliable season or a lucky accident. Pull the five-year view instead and look for the same month peaking every single year. If December lights up five Decembers in a row, that is a season you can plan around. If it lit up once and stayed quiet since, you have your answer.
Deepika Nair from Kochi used the Shopping filter to settle a debate about a summer hydration product. Web Search made it look like a rocket, but Shopping stayed flat, telling her the buzz was curiosity, not purchase intent. Before you leave the tool, scroll to the related and rising queries. Those are free product-variation ideas and ready-made listing keywords, handed to you by the people already searching. For a repeatable way to run this check on every candidate, our guide on choosing the right products for Amazon walks through the full framework.
Amazon BSR History: The Signal That Beats Search Trends
Google Trends shows interest, but interest is not money. Best Seller Rank history shows something closer to the truth: actual sales velocity on real listings competing right now. This is why seasoned sellers lean on amazon bsr history seasonality readings before they trust a search graph. Pull twelve months of BSR on the top two or three listings in the exact subcategory you are eyeing, and the demand shape reveals itself in how the rank moves through the year.
There is one rule you cannot skip: BSR only means anything at the subcategory level. A rank of five thousand in a giant parent category is meaningless, while the same rank inside a tight subcategory can signal strong, steady sales. Use a BSR-to-sales estimator to convert the rank into rough monthly units, then read the line. A flat or improving line points to year-round demand; a sharp curve points to timing risk that belongs on a later launch.
The real power comes from stacking both signals. Good amazon demand forecasting is not one tool, it is a cross-check. When Google Trends and BSR history agree that demand is steady, you have a signal you can order against with confidence. When they disagree, that gap is a warning, and it is far cheaper to investigate it now than to discover it after your stock has landed.
Seasonal Products in India: The Festive Calendar That Sets Your Timeline
India’s demand curve is unusually violent, and if you sell here you have to plan around it. The Great Indian Festival stretch from late September through Diwali can deliver several normal months of volume in about six weeks, with secondary peaks around Republic Day, Prime Day, and wedding season. For anyone dealing with seasonal products amazon india rewards the sellers who treat that calendar as a fixed constraint, not a happy surprise.
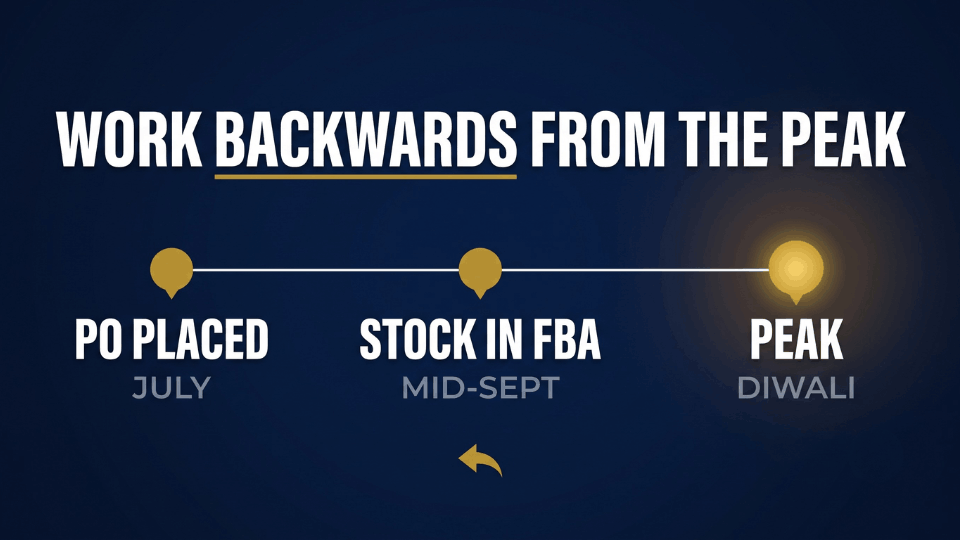
Here is the part that catches people out. Your real order date is not the festival, it is months earlier. Festive stock needs to reach FBA roughly four to six weeks ahead of the peak, because inbound slots tighten as the event nears and late shipments simply miss the window. Sound great indian festival inventory planning means working backwards from the peak through your supplier lead time, which often pushes the actual purchase order out to July.
Farhan Qureshi from Lucknow learned this the useful way. Aiming at Diwali, he mapped it backward: stock in FBA by mid-September, and with a fifty-day lead time between manufacturing and Amazon check-in, his purchase order had to go out in early July. He placed it on time and rode the peak. The seller beside him who “decided to think about it in August” had already missed the year.
Turning the Curve Into an Order Quantity
Reading the curve is worthless until it becomes a number, and the simplest number is weeks of cover. Divide your stock by your trailing weekly sales and you get how many weeks that stock will last. As a working rule, keep six to eight weeks of cover in normal times and build to ten to twelve weeks heading into a known event. That single ratio turns “it feels like enough” into something you can defend. Knowing how much inventory to buy amazon fba sellers can finally answer without guessing.
For a first seasonal order, size it to survive rather than to conquer. Add up your supplier lead time, your reorder window, and a buffer of twenty to thirty percent for the delays that always happen, then order to that, not to your most optimistic dream. A stockout on your first product is annoying; being stuck liquidating thousands of units of the wrong product is business-ending, so err conservative.
Sameer Chauhan from Indore handles this by splitting every order in two. He commits confidently to the year-round baseline he knows will keep selling, then treats the festive top-up as a separate, tighter bet with its own weeks-of-cover target. When the peak underperforms, only the smaller bet takes the hit and his baseline keeps the cash flowing. The numbers behind that target matter too, and our breakdown of cash flow versus profit shows why a “profitable” over-order can still drain your account.
Avoiding Dead Stock After the Spike
The best time to plan your exit is before the peak, not after. Ask yourself the question every festive seller should: how do I avoid dead stock after the festive season? The answer is to decide, in advance, what happens to leftovers. Clearance deals, bundles, and repositioning an item as an everyday product rather than a festive one all keep stock moving. A Diwali gift mug becomes a plain birthday-gift mug in November if you plan the pivot early.
Then there are the fees that quietly punish an over-order, and you need both edges. Cross the long-term storage line at around 270 days and Amazon starts charging surcharges that turn slow stock into a guaranteed loss, so clear aging inventory through deals rather than paying to store it. On the other edge, letting cover drop below roughly 28 days can trigger a low-inventory fee. This is the heart of how to avoid overstock amazon sellers keep chasing: respect both lines at once.
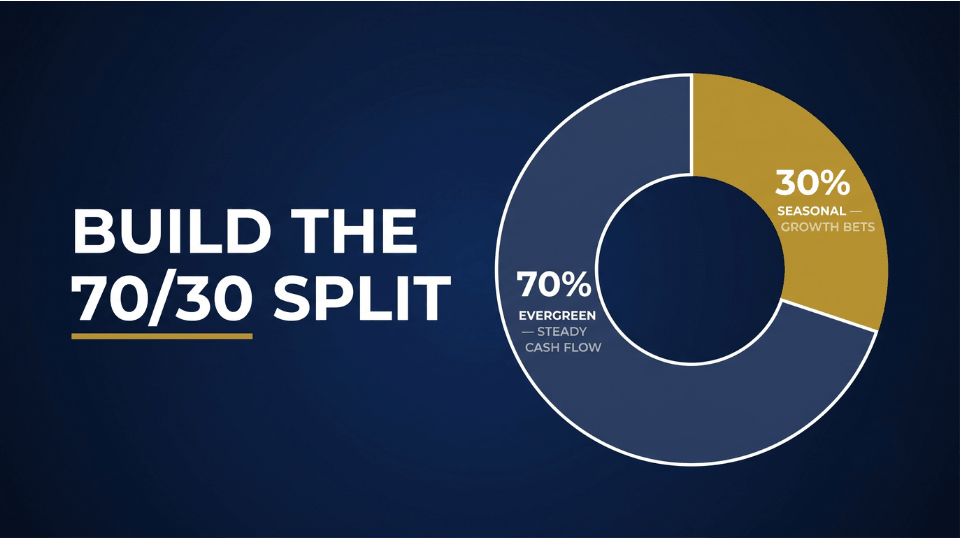
Zoom out and the durable answer is portfolio shape. The steadiest Amazon businesses run something close to seventy percent evergreen products for reliable cash flow and thirty percent seasonal or trending items as growth bets. For your very first product, default to evergreen. Let the calm baseline fund your business while you learn to time the exciting, risky spikes, and that balance is what keeps a stray box of diyas from turning into dead stock amazon fba sellers dread.
Frequently Asked Questions
What is the difference between seasonal and evergreen products on Amazon?
Evergreen products sell at a steady pace all year, giving you predictable cash flow and simple restocking. Seasonal products spike hard for a short window, then go quiet. The difference shows up in the shape of the demand curve, not the category label: a flat line signals evergreen, a sharp hump signals timing risk.
Can a product be both seasonal and evergreen?
Yes, and these hybrids are often the safest first products. They sell modestly all year but enjoy a festive or wedding-season bump on top. A gift-boxed spice set fits this pattern. The year-round baseline quietly absorbs any over-order, so a timing mistake costs a little margin instead of unsellable stock.
How do you read a product’s demand curve on Google Trends?
Switch the filter from Web Search to Shopping so you are watching buyers, not browsers. Then pull the five-year view rather than twelve months and look for the same month peaking every year. A pattern that repeats is a real season. A single unrepeated spike is usually curiosity, not durable demand.
How much inventory should I buy for a seasonal product?
Work from weeks of cover: stock divided by trailing weekly sales. Keep six to eight weeks normally and ten to twelve heading into an event. For a first order, add your lead time and reorder window plus a twenty to thirty percent buffer. Start conservative, because liquidating the wrong product is far costlier than a brief stockout.
How do I avoid dead stock after the festive season?
Plan the exit before the peak. Line up clearance deals, bundles, and a way to reposition the item as an everyday product rather than a festive one. Watch the roughly 270-day long-term storage line and clear slow stock before surcharges hit. Splitting your order into a safe baseline and a tighter festive top-up keeps leftovers small.
How many months of demand data should I check before buying stock?
Twelve months is the minimum to see a full annual cycle, but five years is far better for confirming a pattern. One year can make a lucky accident look like a reliable season. Longer history separates a genuine repeating peak from a one-time jump, which is what your purchase order depends on.
Is Google Trends or BSR history more reliable for reading demand?
BSR history is closer to the truth because it reflects actual sales velocity, while Google Trends only shows search interest. The strongest approach uses both as a cross-check. When they agree demand is steady, order with confidence. When they disagree, treat the gap as a warning worth investigating first.
Should a new seller start with a seasonal or an evergreen product?
Default to evergreen for your first product. Steady year-round demand is more forgiving of estimation mistakes, easier to restock, and less likely to leave you with dead stock. Once you have cash flow and experience, add seasonal and trending products as calculated growth bets around that stable core.
Conclusion
The spike is the easy part to see. Anyone can spot a product selling in October, but the eleven quieter months around it decide whether that October makes you money or leaves you with a warehouse of diyas in December. Reading the full year, through the Shopping filter on Google Trends, twelve months of subcategory BSR, the Indian festive calendar, and a simple weeks-of-cover number, turns a gut-feel order into a decision you can stand behind. Nandini would have ordered a fraction of that second shipment if she had read the whole curve first. If you want the complete product-selection and inventory-planning system taught step by step, join our 3-Day Amazon Business Training and learn to read demand before you ever spend a rupee on stock.
